29
/
en
AIzaSyAYiBZKx7MnpbEhh9jyipgxe19OcubqV5w
April 1, 2024
56006
Small states
SST
false
2
1
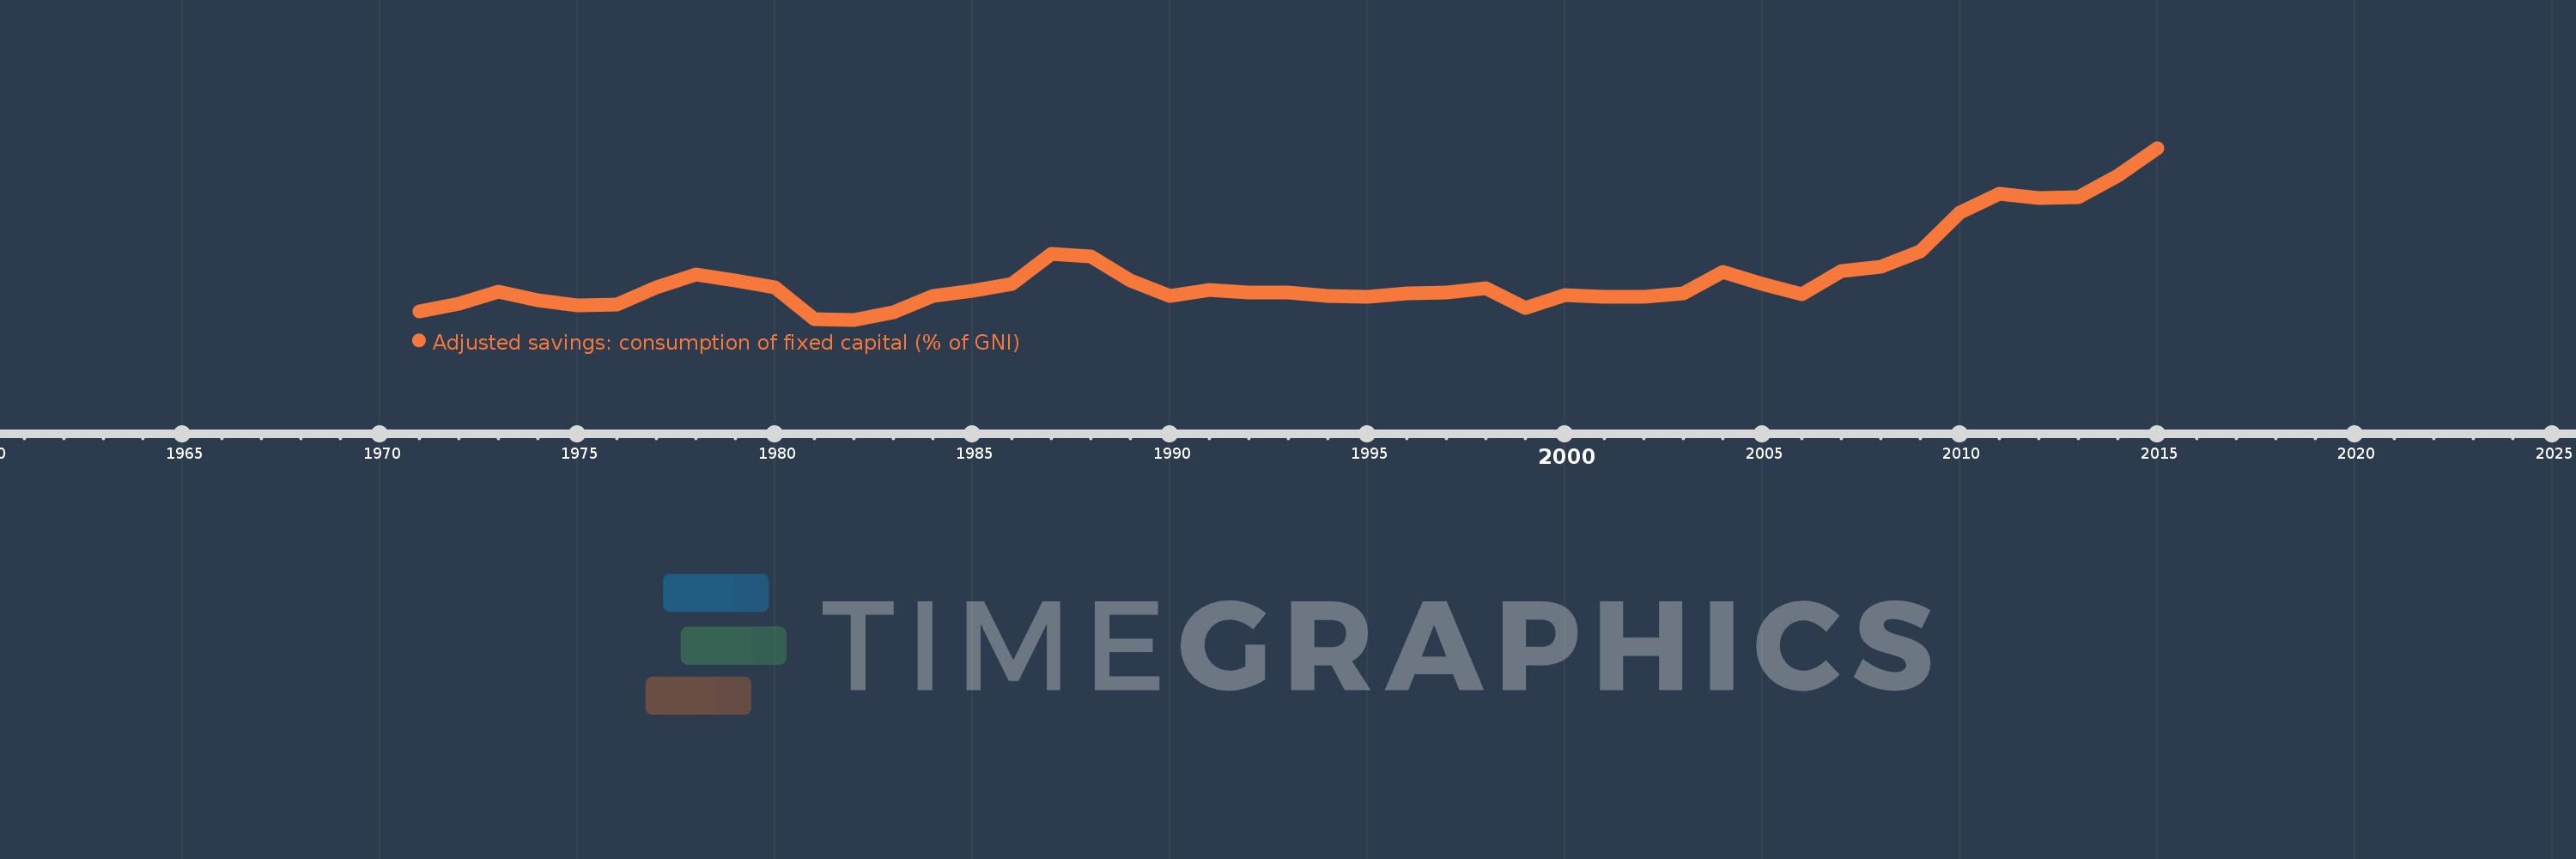
Adjusted savings: consumption of fixed capital (% of GNI)
2015,2014,2013,2012,2011,2010,2009,2008,2007,2006,2005,2004,2003,2002,2001,2000,1999,1998,1997,1996,1995,1994,1993,1992,1991,1990,1989,1988,1987,1986,1985,1984,1983,1982,1981,1980,1979,1978,1977,1976,1975,1974,1973,1972,1971
This statistics in other country:
AfghanistanAlbaniaAlgeriaAndorraAngolaAntigua and BarbudaArab WorldArgentinaArmeniaAustraliaAustriaAzerbaijanBahamas, TheBahrainBangladeshBarbadosBelarusBelgiumBelizeBeninBermudaBhutanBoliviaBosnia and HerzegovinaBotswanaBrazilBrunei DarussalamBulgariaBurkina FasoBurundiCabo VerdeCambodiaCameroonCanadaCaribbean small statesCentral African RepublicCentral Europe and the BalticsChadChileChinaColombiaComorosCongo, Dem. Rep.Congo, Rep.Costa RicaCote d'IvoireCroatiaCubaCyprusCzech RepublicDenmarkDjiboutiDominicaDominican RepublicEarly-demographic dividendEast Asia & PacificEast Asia & Pacific (excluding high income)East Asia & Pacific (IDA & IBRD countries)EcuadorEgypt, Arab Rep.El SalvadorEquatorial GuineaEritreaEstoniaEthiopiaEuro areaEurope & Central AsiaEurope & Central Asia (excluding high income)Europe & Central Asia (IDA & IBRD countries)European UnionFijiFinlandFragile and conflict affected situationsFranceGabonGambia, TheGeorgiaGermanyGhanaGreeceGreenlandGrenadaGuatemalaGuineaGuinea-BissauGuyanaHaitiHeavily indebted poor countries (HIPC)High incomeHondurasHong Kong SAR, ChinaHungaryIBRD onlyIcelandIDA & IBRD totalIDA blendIDA onlyIDA totalIndiaIndonesiaIran, Islamic Rep.IraqIrelandIsraelItalyJamaicaJapanJordanKazakhstanKenyaKiribatiKorea, Rep.KosovoKuwaitKyrgyz RepublicLao PDRLate-demographic dividendLatin America & Caribbean Latin America & Caribbean (excluding high income)Latin America & the Caribbean (IDA & IBRD countries)LatviaLeast developed countries: UN classificationLebanonLesothoLiberiaLibyaLiechtensteinLithuaniaLow & middle incomeLow incomeLower middle incomeLuxembourgMacao SAR, ChinaMacedonia, FYRMadagascarMalawiMalaysiaMaldivesMaliMaltaMarshall IslandsMauritaniaMauritiusMexicoMicronesia, Fed. Sts.Middle East & North AfricaMiddle East & North Africa (excluding high income)Middle East & North Africa (IDA & IBRD countries)Middle incomeMoldovaMonacoMongoliaMontenegroMoroccoMozambiqueMyanmarNamibiaNepalNetherlandsNew ZealandNicaraguaNigerNigeriaNorth AmericaNorwayOECD membersOmanOther small statesPacific island small statesPakistanPalauPanamaPapua New GuineaParaguayPeruPhilippinesPolandPortugalPost-demographic dividendPre-demographic dividendPuerto RicoQatarRomaniaRussian FederationRwandaSamoaSan MarinoSao Tome and PrincipeSaudi ArabiaSenegalSerbiaSeychellesSierra LeoneSingaporeSlovak RepublicSloveniaSmall statesSolomon IslandsSouth AfricaSouth AsiaSouth Asia (IDA & IBRD)SpainSri LankaSt. Kitts and NevisSt. LuciaSt. Vincent and the GrenadinesSub-Saharan Africa Sub-Saharan Africa (excluding high income)Sub-Saharan Africa (IDA & IBRD countries)SudanSurinameSwazilandSwedenSwitzerlandSyrian Arab RepublicTajikistanTanzaniaThailandTimor-LesteTogoTongaTrinidad and TobagoTunisiaTurkeyTurkmenistanTuvaluUgandaUkraineUnited Arab EmiratesUnited KingdomUnited StatesUpper middle incomeUruguayUzbekistanVanuatuVenezuela, RBVietnamWest Bank and GazaWorldYemen, Rep.ZambiaZimbabwe Timeline:
This timeline shows a graph from 1971 to 2015 of Small states. No data until 1970. Number of actual observations by date: 45.
Source name:
World Development Indicators
Source organization:
World Bank staff estimates using data from the United Nations Statistics Division's National Accounts Statistics.
Categories, topics:
Economy & Growth, Environment
Last updated:
apr 23, 2017
Indicators value changes by year
Maximum:
15.386
jan 1, 2015
At the date of observation
Value
Absolute change
Change from previous value
jan 1, 1971
10.228
+10.228
0.0%
jan 1, 1972
10.473
+0.244
2.39%
jan 1, 1973
10.843
+0.37
3.54%
jan 1, 1974
10.577
-0.266
-2.45%
jan 1, 1975
10.413
-0.164
-1.55%
jan 1, 1976
10.435
+0.021
0.2%
jan 1, 1977
10.993
+0.558
5.35%
jan 1, 1978
11.399
+0.407
3.7%
jan 1, 1979
11.216
-0.183
-1.61%
jan 1, 1980
10.989
-0.226
-2.02%
jan 1, 1981
9.976
-1.014
-9.23%
jan 1, 1982
9.964
-0.012
-0.12%
jan 1, 1983
10.204
+0.24
2.41%
jan 1, 1984
10.705
+0.501
4.91%
jan 1, 1985
10.875
+0.17
1.59%
jan 1, 1986
11.093
+0.217
2.0%
jan 1, 1987
12.034
+0.941
8.49%
jan 1, 1988
11.96
-0.074
-0.62%
jan 1, 1989
11.205
-0.755
-6.31%
jan 1, 1990
10.704
-0.501
-4.47%
jan 1, 1991
10.895
+0.191
1.79%
jan 1, 1992
10.816
-0.079
-0.73%
jan 1, 1993
10.819
+0.003
0.03%
jan 1, 1994
10.706
-0.113
-1.05%
jan 1, 1995
10.683
-0.023
-0.21%
jan 1, 1996
10.8
+0.116
1.09%
jan 1, 1997
10.828
+0.028
0.26%
jan 1, 1998
10.949
+0.121
1.12%
jan 1, 1999
10.345
-0.603
-5.51%
jan 1, 2000
10.737
+0.391
3.78%
jan 1, 2001
10.696
-0.04
-0.38%
jan 1, 2002
10.691
-0.005
-0.04%
jan 1, 2003
10.788
+0.096
0.9%
jan 1, 2004
11.486
+0.699
6.48%
jan 1, 2005
11.086
-0.401
-3.49%
jan 1, 2006
10.758
-0.328
-2.96%
jan 1, 2007
11.494
+0.736
6.84%
jan 1, 2008
11.63
+0.136
1.18%
jan 1, 2009
12.112
+0.481
4.14%
jan 1, 2010
13.342
+1.23
10.16%
jan 1, 2011
13.929
+0.587
4.4%
jan 1, 2012
13.819
-0.11
-0.79%
jan 1, 2013
13.832
+0.014
0.1%
jan 1, 2014
14.498
+0.666
4.81%
jan 1, 2015
15.386
+0.887
6.12%
Ranking of countries by current statistics by years


Comments: