29
/
en
AIzaSyAYiBZKx7MnpbEhh9jyipgxe19OcubqV5w
April 1, 2024
151305
Hong Kong SAR, China
HKG
true
2
1
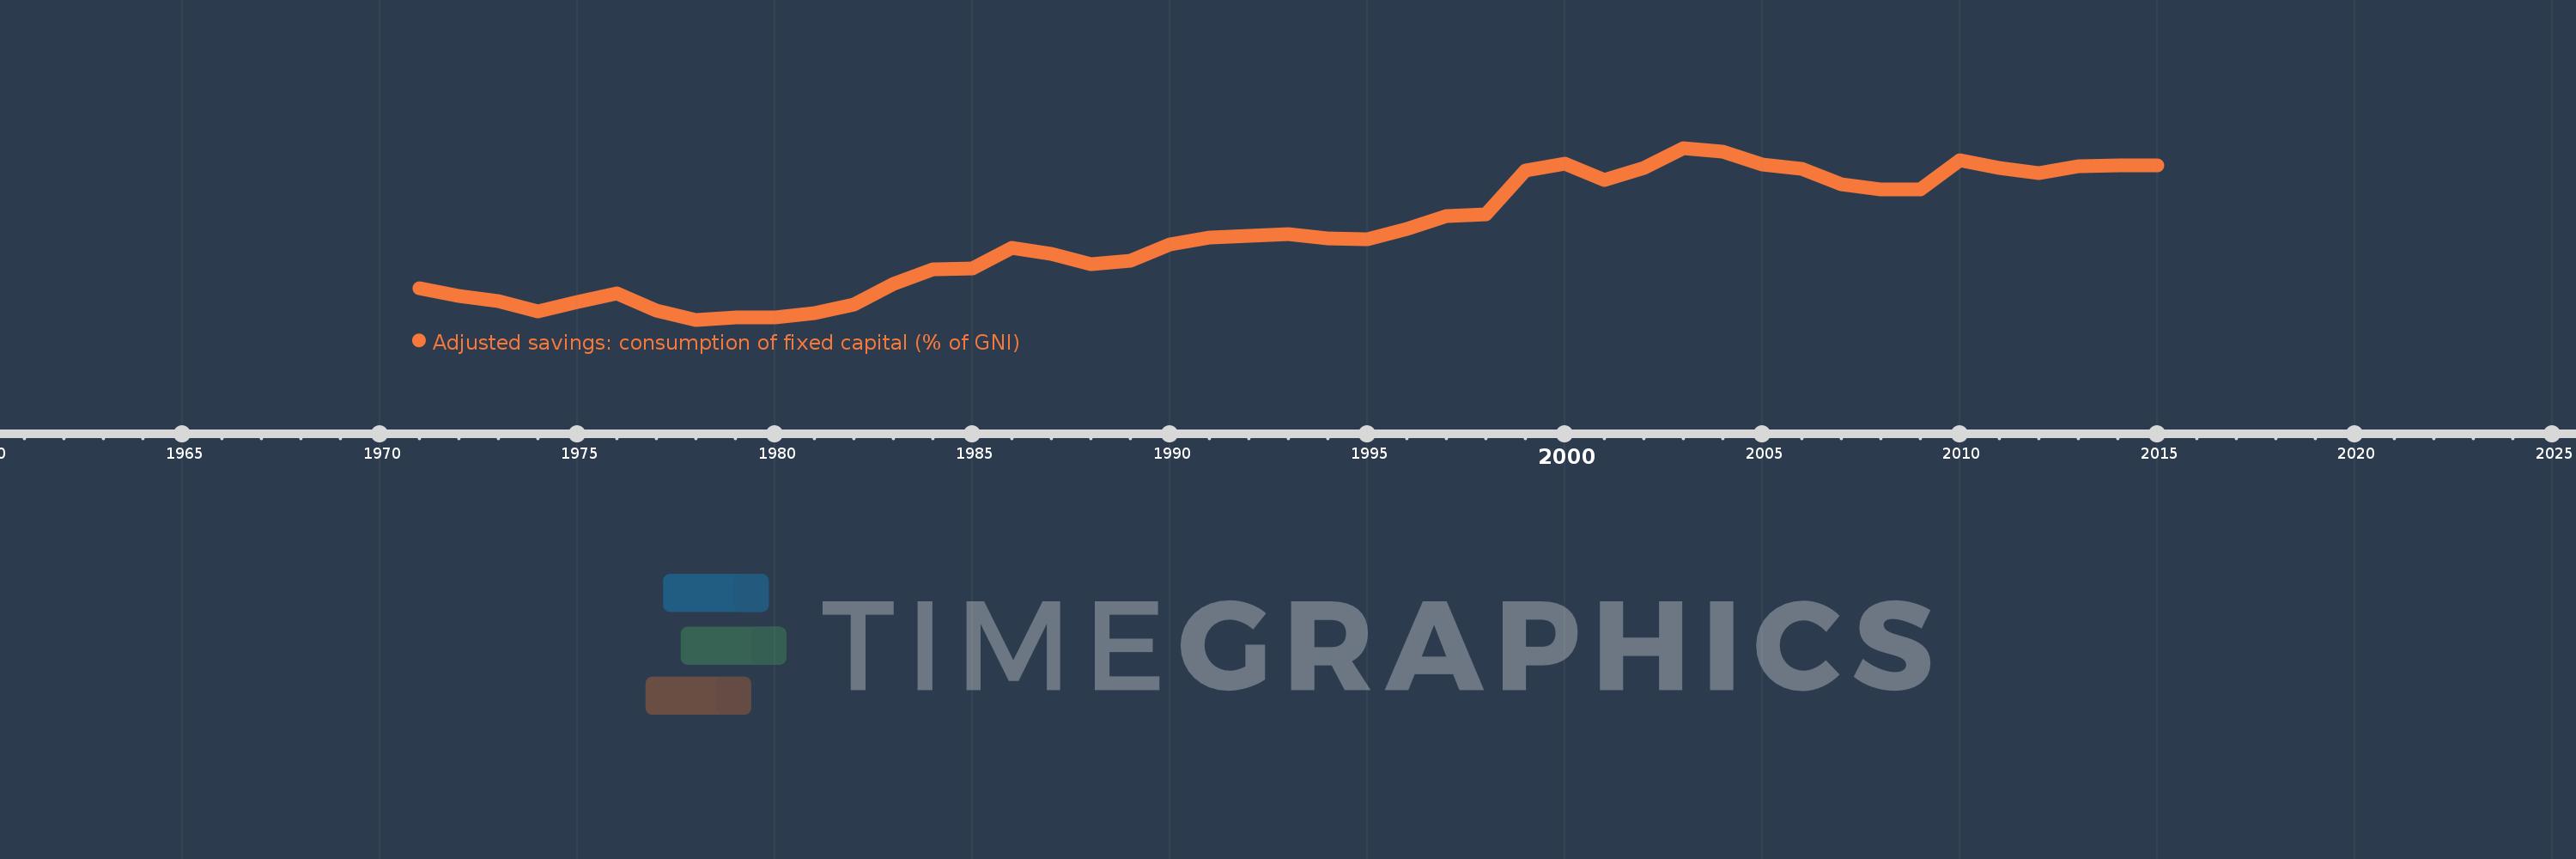
Adjusted savings: consumption of fixed capital (% of GNI)
2015,2014,2013,2012,2011,2010,2009,2008,2007,2006,2005,2004,2003,2002,2001,2000,1999,1998,1997,1996,1995,1994,1993,1992,1991,1990,1989,1988,1987,1986,1985,1984,1983,1982,1981,1980,1979,1978,1977,1976,1975,1974,1973,1972,1971
This statistics in other country:
AfghanistanAlbaniaAlgeriaAndorraAngolaAntigua and BarbudaArab WorldArgentinaArmeniaAustraliaAustriaAzerbaijanBahamas, TheBahrainBangladeshBarbadosBelarusBelgiumBelizeBeninBermudaBhutanBoliviaBosnia and HerzegovinaBotswanaBrazilBrunei DarussalamBulgariaBurkina FasoBurundiCabo VerdeCambodiaCameroonCanadaCaribbean small statesCentral African RepublicCentral Europe and the BalticsChadChileChinaColombiaComorosCongo, Dem. Rep.Congo, Rep.Costa RicaCote d'IvoireCroatiaCubaCyprusCzech RepublicDenmarkDjiboutiDominicaDominican RepublicEarly-demographic dividendEast Asia & PacificEast Asia & Pacific (excluding high income)East Asia & Pacific (IDA & IBRD countries)EcuadorEgypt, Arab Rep.El SalvadorEquatorial GuineaEritreaEstoniaEthiopiaEuro areaEurope & Central AsiaEurope & Central Asia (excluding high income)Europe & Central Asia (IDA & IBRD countries)European UnionFijiFinlandFragile and conflict affected situationsFranceGabonGambia, TheGeorgiaGermanyGhanaGreeceGreenlandGrenadaGuatemalaGuineaGuinea-BissauGuyanaHaitiHeavily indebted poor countries (HIPC)High incomeHondurasHong Kong SAR, ChinaHungaryIBRD onlyIcelandIDA & IBRD totalIDA blendIDA onlyIDA totalIndiaIndonesiaIran, Islamic Rep.IraqIrelandIsraelItalyJamaicaJapanJordanKazakhstanKenyaKiribatiKorea, Rep.KosovoKuwaitKyrgyz RepublicLao PDRLate-demographic dividendLatin America & Caribbean Latin America & Caribbean (excluding high income)Latin America & the Caribbean (IDA & IBRD countries)LatviaLeast developed countries: UN classificationLebanonLesothoLiberiaLibyaLiechtensteinLithuaniaLow & middle incomeLow incomeLower middle incomeLuxembourgMacao SAR, ChinaMacedonia, FYRMadagascarMalawiMalaysiaMaldivesMaliMaltaMarshall IslandsMauritaniaMauritiusMexicoMicronesia, Fed. Sts.Middle East & North AfricaMiddle East & North Africa (excluding high income)Middle East & North Africa (IDA & IBRD countries)Middle incomeMoldovaMonacoMongoliaMontenegroMoroccoMozambiqueMyanmarNamibiaNepalNetherlandsNew ZealandNicaraguaNigerNigeriaNorth AmericaNorwayOECD membersOmanOther small statesPacific island small statesPakistanPalauPanamaPapua New GuineaParaguayPeruPhilippinesPolandPortugalPost-demographic dividendPre-demographic dividendPuerto RicoQatarRomaniaRussian FederationRwandaSamoaSan MarinoSao Tome and PrincipeSaudi ArabiaSenegalSerbiaSeychellesSierra LeoneSingaporeSlovak RepublicSloveniaSmall statesSolomon IslandsSouth AfricaSouth AsiaSouth Asia (IDA & IBRD)SpainSri LankaSt. Kitts and NevisSt. LuciaSt. Vincent and the GrenadinesSub-Saharan Africa Sub-Saharan Africa (excluding high income)Sub-Saharan Africa (IDA & IBRD countries)SudanSurinameSwazilandSwedenSwitzerlandSyrian Arab RepublicTajikistanTanzaniaThailandTimor-LesteTogoTongaTrinidad and TobagoTunisiaTurkeyTurkmenistanTuvaluUgandaUkraineUnited Arab EmiratesUnited KingdomUnited StatesUpper middle incomeUruguayUzbekistanVanuatuVenezuela, RBVietnamWest Bank and GazaWorldYemen, Rep.ZambiaZimbabwe Timeline:
This timeline shows a graph from 1971 to 2015 of Hong Kong SAR, China. No data until 1970. Number of actual observations by date: 45.
Source name:
World Development Indicators
Source organization:
World Bank staff estimates using data from the United Nations Statistics Division's National Accounts Statistics.
Categories, topics:
Economy & Growth, Environment
Last updated:
apr 23, 2017
Indicators value changes by year
At the date of observation
Value
Absolute change
Change from previous value
jan 1, 1971
7.109
+7.109
0.0%
jan 1, 1972
6.83
-0.28
-3.94%
jan 1, 1973
6.61
-0.22
-3.22%
jan 1, 1974
6.24
-0.37
-5.59%
jan 1, 1975
6.579
+0.339
5.43%
jan 1, 1976
6.93
+0.351
5.34%
jan 1, 1977
6.247
-0.683
-9.86%
jan 1, 1978
5.91
-0.337
-5.4%
jan 1, 1979
6.011
+0.101
1.71%
jan 1, 1980
6.0
-0.011
-0.18%
jan 1, 1981
6.153
+0.153
2.56%
jan 1, 1982
6.506
+0.353
5.74%
jan 1, 1983
7.284
+0.778
11.95%
jan 1, 1984
7.857
+0.573
7.87%
jan 1, 1985
7.89
+0.033
0.42%
jan 1, 1986
8.682
+0.793
10.05%
jan 1, 1987
8.44
-0.242
-2.79%
jan 1, 1988
8.043
-0.397
-4.71%
jan 1, 1989
8.174
+0.131
1.63%
jan 1, 1990
8.791
+0.617
7.55%
jan 1, 1991
9.051
+0.26
2.96%
jan 1, 1992
9.144
+0.092
1.02%
jan 1, 1993
9.197
+0.053
0.58%
jan 1, 1994
9.04
-0.157
-1.71%
jan 1, 1995
8.982
-0.058
-0.64%
jan 1, 1996
9.404
+0.421
4.69%
jan 1, 1997
9.873
+0.469
4.99%
jan 1, 1998
9.943
+0.07
0.71%
jan 1, 1999
11.617
+1.674
16.83%
jan 1, 2000
11.899
+0.282
2.43%
jan 1, 2001
11.28
-0.619
-5.2%
jan 1, 2002
11.734
+0.454
4.03%
jan 1, 2003
12.5
+0.766
6.53%
jan 1, 2004
12.361
-0.139
-1.12%
jan 1, 2005
11.855
-0.506
-4.09%
jan 1, 2006
11.702
-0.153
-1.29%
jan 1, 2007
11.108
-0.593
-5.07%
jan 1, 2008
10.921
-0.187
-1.69%
jan 1, 2009
10.924
+0.003
0.03%
jan 1, 2010
12.019
+1.095
10.02%
jan 1, 2011
11.729
-0.29
-2.41%
jan 1, 2012
11.546
-0.183
-1.56%
jan 1, 2013
11.788
+0.243
2.1%
jan 1, 2014
11.833
+0.044
0.38%
jan 1, 2015
11.836
+0.003
0.03%
Ranking of countries by current statistics by years


Comments: