29
/
en
AIzaSyAYiBZKx7MnpbEhh9jyipgxe19OcubqV5w
April 1, 2024
253834
Suriname
SUR
true
2
1
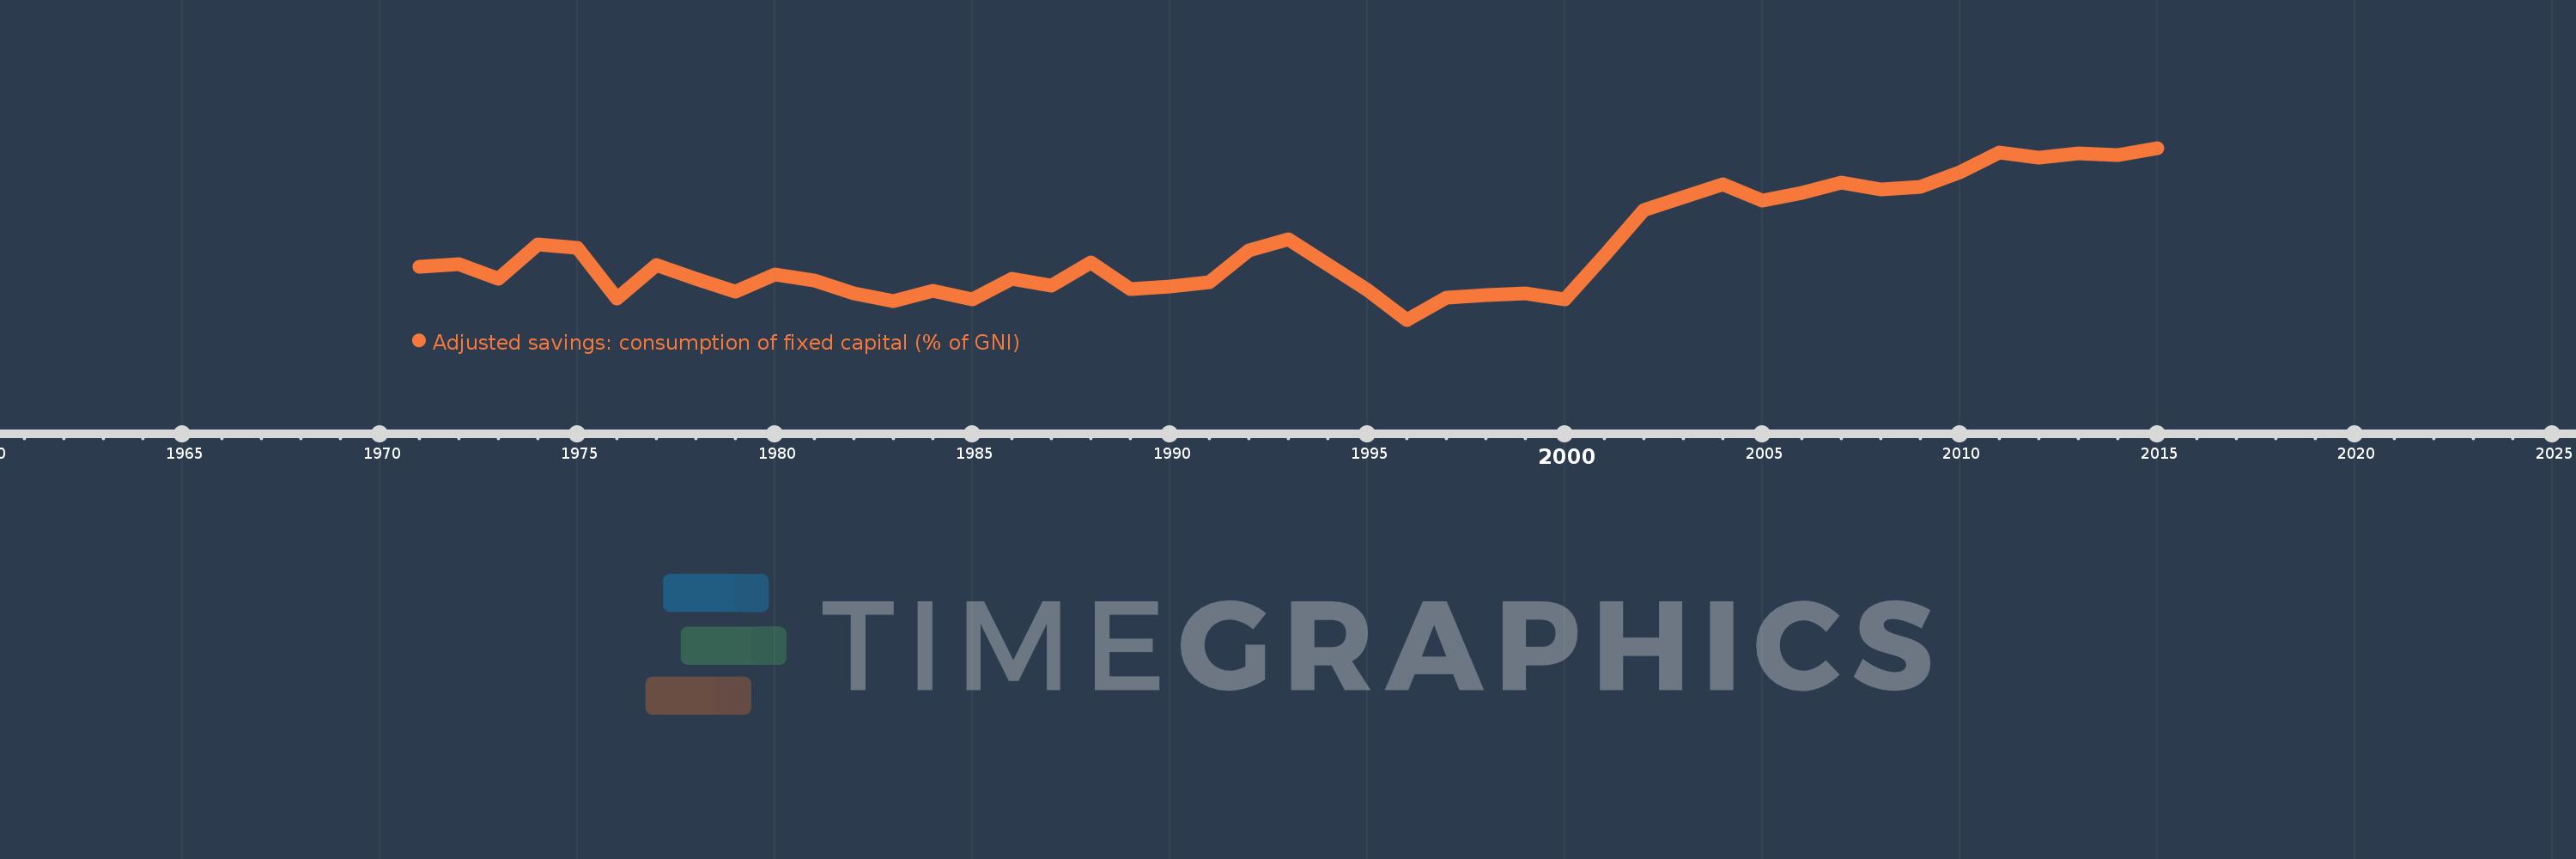
Adjusted savings: consumption of fixed capital (% of GNI)
2015,2014,2013,2012,2011,2010,2009,2008,2007,2006,2005,2004,2003,2002,2001,2000,1999,1998,1997,1996,1995,1993,1992,1991,1990,1989,1988,1987,1986,1985,1984,1983,1982,1981,1980,1979,1978,1977,1976,1975,1974,1973,1972,1971
This statistics in other country:
AfghanistanAlbaniaAlgeriaAndorraAngolaAntigua and BarbudaArab WorldArgentinaArmeniaAustraliaAustriaAzerbaijanBahamas, TheBahrainBangladeshBarbadosBelarusBelgiumBelizeBeninBermudaBhutanBoliviaBosnia and HerzegovinaBotswanaBrazilBrunei DarussalamBulgariaBurkina FasoBurundiCabo VerdeCambodiaCameroonCanadaCaribbean small statesCentral African RepublicCentral Europe and the BalticsChadChileChinaColombiaComorosCongo, Dem. Rep.Congo, Rep.Costa RicaCote d'IvoireCroatiaCubaCyprusCzech RepublicDenmarkDjiboutiDominicaDominican RepublicEarly-demographic dividendEast Asia & PacificEast Asia & Pacific (excluding high income)East Asia & Pacific (IDA & IBRD countries)EcuadorEgypt, Arab Rep.El SalvadorEquatorial GuineaEritreaEstoniaEthiopiaEuro areaEurope & Central AsiaEurope & Central Asia (excluding high income)Europe & Central Asia (IDA & IBRD countries)European UnionFijiFinlandFragile and conflict affected situationsFranceGabonGambia, TheGeorgiaGermanyGhanaGreeceGreenlandGrenadaGuatemalaGuineaGuinea-BissauGuyanaHaitiHeavily indebted poor countries (HIPC)High incomeHondurasHong Kong SAR, ChinaHungaryIBRD onlyIcelandIDA & IBRD totalIDA blendIDA onlyIDA totalIndiaIndonesiaIran, Islamic Rep.IraqIrelandIsraelItalyJamaicaJapanJordanKazakhstanKenyaKiribatiKorea, Rep.KosovoKuwaitKyrgyz RepublicLao PDRLate-demographic dividendLatin America & Caribbean Latin America & Caribbean (excluding high income)Latin America & the Caribbean (IDA & IBRD countries)LatviaLeast developed countries: UN classificationLebanonLesothoLiberiaLibyaLiechtensteinLithuaniaLow & middle incomeLow incomeLower middle incomeLuxembourgMacao SAR, ChinaMacedonia, FYRMadagascarMalawiMalaysiaMaldivesMaliMaltaMarshall IslandsMauritaniaMauritiusMexicoMicronesia, Fed. Sts.Middle East & North AfricaMiddle East & North Africa (excluding high income)Middle East & North Africa (IDA & IBRD countries)Middle incomeMoldovaMonacoMongoliaMontenegroMoroccoMozambiqueMyanmarNamibiaNepalNetherlandsNew ZealandNicaraguaNigerNigeriaNorth AmericaNorwayOECD membersOmanOther small statesPacific island small statesPakistanPalauPanamaPapua New GuineaParaguayPeruPhilippinesPolandPortugalPost-demographic dividendPre-demographic dividendPuerto RicoQatarRomaniaRussian FederationRwandaSamoaSan MarinoSao Tome and PrincipeSaudi ArabiaSenegalSerbiaSeychellesSierra LeoneSingaporeSlovak RepublicSloveniaSmall statesSolomon IslandsSouth AfricaSouth AsiaSouth Asia (IDA & IBRD)SpainSri LankaSt. Kitts and NevisSt. LuciaSt. Vincent and the GrenadinesSub-Saharan Africa Sub-Saharan Africa (excluding high income)Sub-Saharan Africa (IDA & IBRD countries)SudanSurinameSwazilandSwedenSwitzerlandSyrian Arab RepublicTajikistanTanzaniaThailandTimor-LesteTogoTongaTrinidad and TobagoTunisiaTurkeyTurkmenistanTuvaluUgandaUkraineUnited Arab EmiratesUnited KingdomUnited StatesUpper middle incomeUruguayUzbekistanVanuatuVenezuela, RBVietnamWest Bank and GazaWorldYemen, Rep.ZambiaZimbabwe Timeline:
This timeline shows a graph from 1971 to 2015 of Suriname. No data until 1970. Number of actual observations by date: 44.
Source name:
World Development Indicators
Source organization:
World Bank staff estimates using data from the United Nations Statistics Division's National Accounts Statistics.
Categories, topics:
Economy & Growth, Environment
Last updated:
apr 23, 2017
Indicators value changes by year
Maximum:
18.722
jan 1, 2015
At the date of observation
Value
Absolute change
Change from previous value
jan 1, 1971
11.847
+11.847
0.0%
jan 1, 1972
12.004
+0.157
1.32%
jan 1, 1973
11.148
-0.856
-7.13%
jan 1, 1974
13.166
+2.018
18.1%
jan 1, 1975
12.943
-0.223
-1.69%
jan 1, 1976
10.038
-2.905
-22.45%
jan 1, 1977
11.946
+1.909
19.02%
jan 1, 1978
11.156
-0.791
-6.62%
jan 1, 1979
10.428
-0.728
-6.52%
jan 1, 1980
11.419
+0.991
9.5%
jan 1, 1981
11.073
-0.346
-3.03%
jan 1, 1982
10.348
-0.725
-6.55%
jan 1, 1983
9.889
-0.459
-4.43%
jan 1, 1984
10.461
+0.572
5.78%
jan 1, 1985
9.994
-0.467
-4.47%
jan 1, 1986
11.148
+1.154
11.55%
jan 1, 1987
10.781
-0.367
-3.29%
jan 1, 1988
12.101
+1.32
12.24%
jan 1, 1989
10.583
-1.518
-12.55%
jan 1, 1990
10.714
+0.131
1.24%
jan 1, 1991
10.992
+0.279
2.6%
jan 1, 1992
12.785
+1.793
16.31%
jan 1, 1993
13.456
+0.671
5.25%
jan 1, 1995
10.524
-2.932
-21.79%
jan 1, 1996
8.802
-1.723
-16.37%
jan 1, 1997
10.06
+1.258
14.29%
jan 1, 1998
10.213
+0.154
1.53%
jan 1, 1999
10.343
+0.13
1.27%
jan 1, 2000
9.965
-0.378
-3.66%
jan 1, 2001
12.499
+2.534
25.43%
jan 1, 2002
15.112
+2.613
20.91%
jan 1, 2003
15.897
+0.785
5.19%
jan 1, 2004
16.625
+0.728
4.58%
jan 1, 2005
15.68
-0.945
-5.68%
jan 1, 2006
16.145
+0.464
2.96%
jan 1, 2007
16.705
+0.56
3.47%
jan 1, 2008
16.309
-0.396
-2.37%
jan 1, 2009
16.493
+0.184
1.13%
jan 1, 2010
17.296
+0.803
4.87%
jan 1, 2011
18.458
+1.163
6.72%
jan 1, 2012
18.178
-0.28
-1.52%
jan 1, 2013
18.386
+0.208
1.14%
jan 1, 2014
18.291
-0.095
-0.51%
jan 1, 2015
18.722
+0.431
2.36%
Ranking of countries by current statistics by years


Comments: