29
/
en
AIzaSyAYiBZKx7MnpbEhh9jyipgxe19OcubqV5w
April 1, 2024
204902
Namibia
NAM
true
2
1
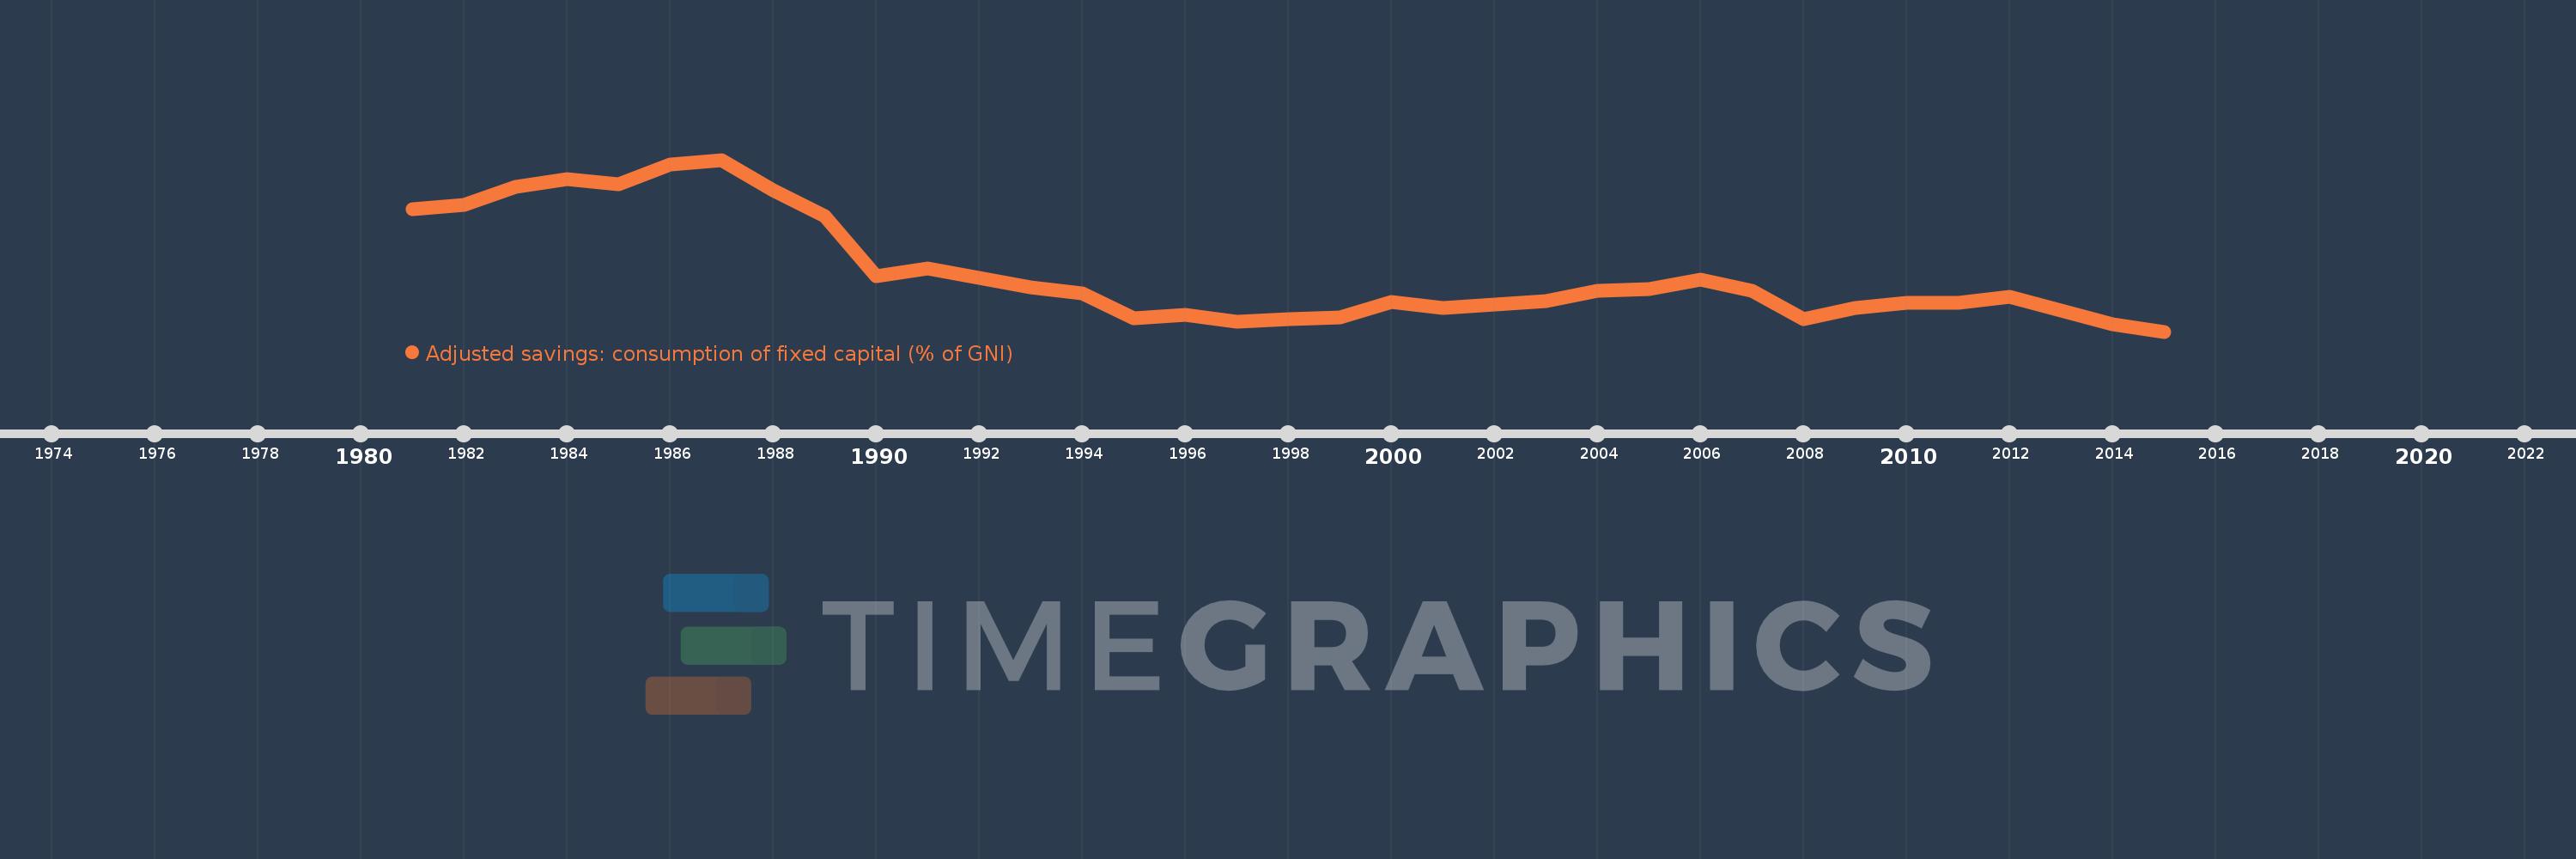
Adjusted savings: consumption of fixed capital (% of GNI)
2015,2014,2013,2012,2011,2010,2009,2008,2007,2006,2005,2004,2003,2002,2001,2000,1999,1998,1997,1996,1995,1994,1993,1992,1991,1990,1989,1988,1987,1986,1985,1984,1983,1982,1981
This statistics in other country:
AfghanistanAlbaniaAlgeriaAndorraAngolaAntigua and BarbudaArab WorldArgentinaArmeniaAustraliaAustriaAzerbaijanBahamas, TheBahrainBangladeshBarbadosBelarusBelgiumBelizeBeninBermudaBhutanBoliviaBosnia and HerzegovinaBotswanaBrazilBrunei DarussalamBulgariaBurkina FasoBurundiCabo VerdeCambodiaCameroonCanadaCaribbean small statesCentral African RepublicCentral Europe and the BalticsChadChileChinaColombiaComorosCongo, Dem. Rep.Congo, Rep.Costa RicaCote d'IvoireCroatiaCubaCyprusCzech RepublicDenmarkDjiboutiDominicaDominican RepublicEarly-demographic dividendEast Asia & PacificEast Asia & Pacific (excluding high income)East Asia & Pacific (IDA & IBRD countries)EcuadorEgypt, Arab Rep.El SalvadorEquatorial GuineaEritreaEstoniaEthiopiaEuro areaEurope & Central AsiaEurope & Central Asia (excluding high income)Europe & Central Asia (IDA & IBRD countries)European UnionFijiFinlandFragile and conflict affected situationsFranceGabonGambia, TheGeorgiaGermanyGhanaGreeceGreenlandGrenadaGuatemalaGuineaGuinea-BissauGuyanaHaitiHeavily indebted poor countries (HIPC)High incomeHondurasHong Kong SAR, ChinaHungaryIBRD onlyIcelandIDA & IBRD totalIDA blendIDA onlyIDA totalIndiaIndonesiaIran, Islamic Rep.IraqIrelandIsraelItalyJamaicaJapanJordanKazakhstanKenyaKiribatiKorea, Rep.KosovoKuwaitKyrgyz RepublicLao PDRLate-demographic dividendLatin America & Caribbean Latin America & Caribbean (excluding high income)Latin America & the Caribbean (IDA & IBRD countries)LatviaLeast developed countries: UN classificationLebanonLesothoLiberiaLibyaLiechtensteinLithuaniaLow & middle incomeLow incomeLower middle incomeLuxembourgMacao SAR, ChinaMacedonia, FYRMadagascarMalawiMalaysiaMaldivesMaliMaltaMarshall IslandsMauritaniaMauritiusMexicoMicronesia, Fed. Sts.Middle East & North AfricaMiddle East & North Africa (excluding high income)Middle East & North Africa (IDA & IBRD countries)Middle incomeMoldovaMonacoMongoliaMontenegroMoroccoMozambiqueMyanmarNamibiaNepalNetherlandsNew ZealandNicaraguaNigerNigeriaNorth AmericaNorwayOECD membersOmanOther small statesPacific island small statesPakistanPalauPanamaPapua New GuineaParaguayPeruPhilippinesPolandPortugalPost-demographic dividendPre-demographic dividendPuerto RicoQatarRomaniaRussian FederationRwandaSamoaSan MarinoSao Tome and PrincipeSaudi ArabiaSenegalSerbiaSeychellesSierra LeoneSingaporeSlovak RepublicSloveniaSmall statesSolomon IslandsSouth AfricaSouth AsiaSouth Asia (IDA & IBRD)SpainSri LankaSt. Kitts and NevisSt. LuciaSt. Vincent and the GrenadinesSub-Saharan Africa Sub-Saharan Africa (excluding high income)Sub-Saharan Africa (IDA & IBRD countries)SudanSurinameSwazilandSwedenSwitzerlandSyrian Arab RepublicTajikistanTanzaniaThailandTimor-LesteTogoTongaTrinidad and TobagoTunisiaTurkeyTurkmenistanTuvaluUgandaUkraineUnited Arab EmiratesUnited KingdomUnited StatesUpper middle incomeUruguayUzbekistanVanuatuVenezuela, RBVietnamWest Bank and GazaWorldYemen, Rep.ZambiaZimbabwe Timeline:
This timeline shows a graph from 1981 to 2015 of Namibia. No data until 1980. Number of actual observations by date: 35.
Source name:
World Development Indicators
Source organization:
World Bank staff estimates using data from the United Nations Statistics Division's National Accounts Statistics.
Categories, topics:
Economy & Growth, Environment
Last updated:
apr 23, 2017
Indicators value changes by year
Maximum:
18.344
jan 1, 1987
At the date of observation
Value
Absolute change
Change from previous value
jan 1, 1981
15.651
+15.651
0.0%
jan 1, 1982
15.897
+0.246
1.57%
jan 1, 1983
16.888
+0.991
6.23%
jan 1, 1984
17.296
+0.408
2.42%
jan 1, 1985
17.007
-0.289
-1.67%
jan 1, 1986
18.079
+1.072
6.3%
jan 1, 1987
18.344
+0.265
1.47%
jan 1, 1988
16.704
-1.64
-8.94%
jan 1, 1989
15.271
-1.434
-8.58%
jan 1, 1990
12.008
-3.263
-21.36%
jan 1, 1991
12.43
+0.422
3.51%
jan 1, 1992
11.919
-0.511
-4.11%
jan 1, 1993
11.396
-0.524
-4.39%
jan 1, 1994
11.065
-0.33
-2.9%
jan 1, 1995
9.694
-1.372
-12.4%
jan 1, 1996
9.906
+0.213
2.19%
jan 1, 1997
9.538
-0.368
-3.71%
jan 1, 1998
9.679
+0.14
1.47%
jan 1, 1999
9.743
+0.064
0.66%
jan 1, 2000
10.587
+0.845
8.67%
jan 1, 2001
10.256
-0.331
-3.13%
jan 1, 2002
10.443
+0.187
1.83%
jan 1, 2003
10.656
+0.213
2.04%
jan 1, 2004
11.206
+0.55
5.16%
jan 1, 2005
11.3
+0.094
0.84%
jan 1, 2006
11.819
+0.519
4.59%
jan 1, 2007
11.215
-0.603
-5.1%
jan 1, 2008
9.666
-1.55
-13.82%
jan 1, 2009
10.269
+0.604
6.25%
jan 1, 2010
10.559
+0.289
2.82%
jan 1, 2011
10.535
-0.024
-0.23%
jan 1, 2012
10.869
+0.334
3.17%
jan 1, 2013
10.116
-0.753
-6.93%
jan 1, 2014
9.396
-0.72
-7.12%
jan 1, 2015
8.991
-0.405
-4.31%
Ranking of countries by current statistics by years


Comments: