29
/
en
AIzaSyAYiBZKx7MnpbEhh9jyipgxe19OcubqV5w
April 1, 2024
142679
Grenada
GRD
true
2
1
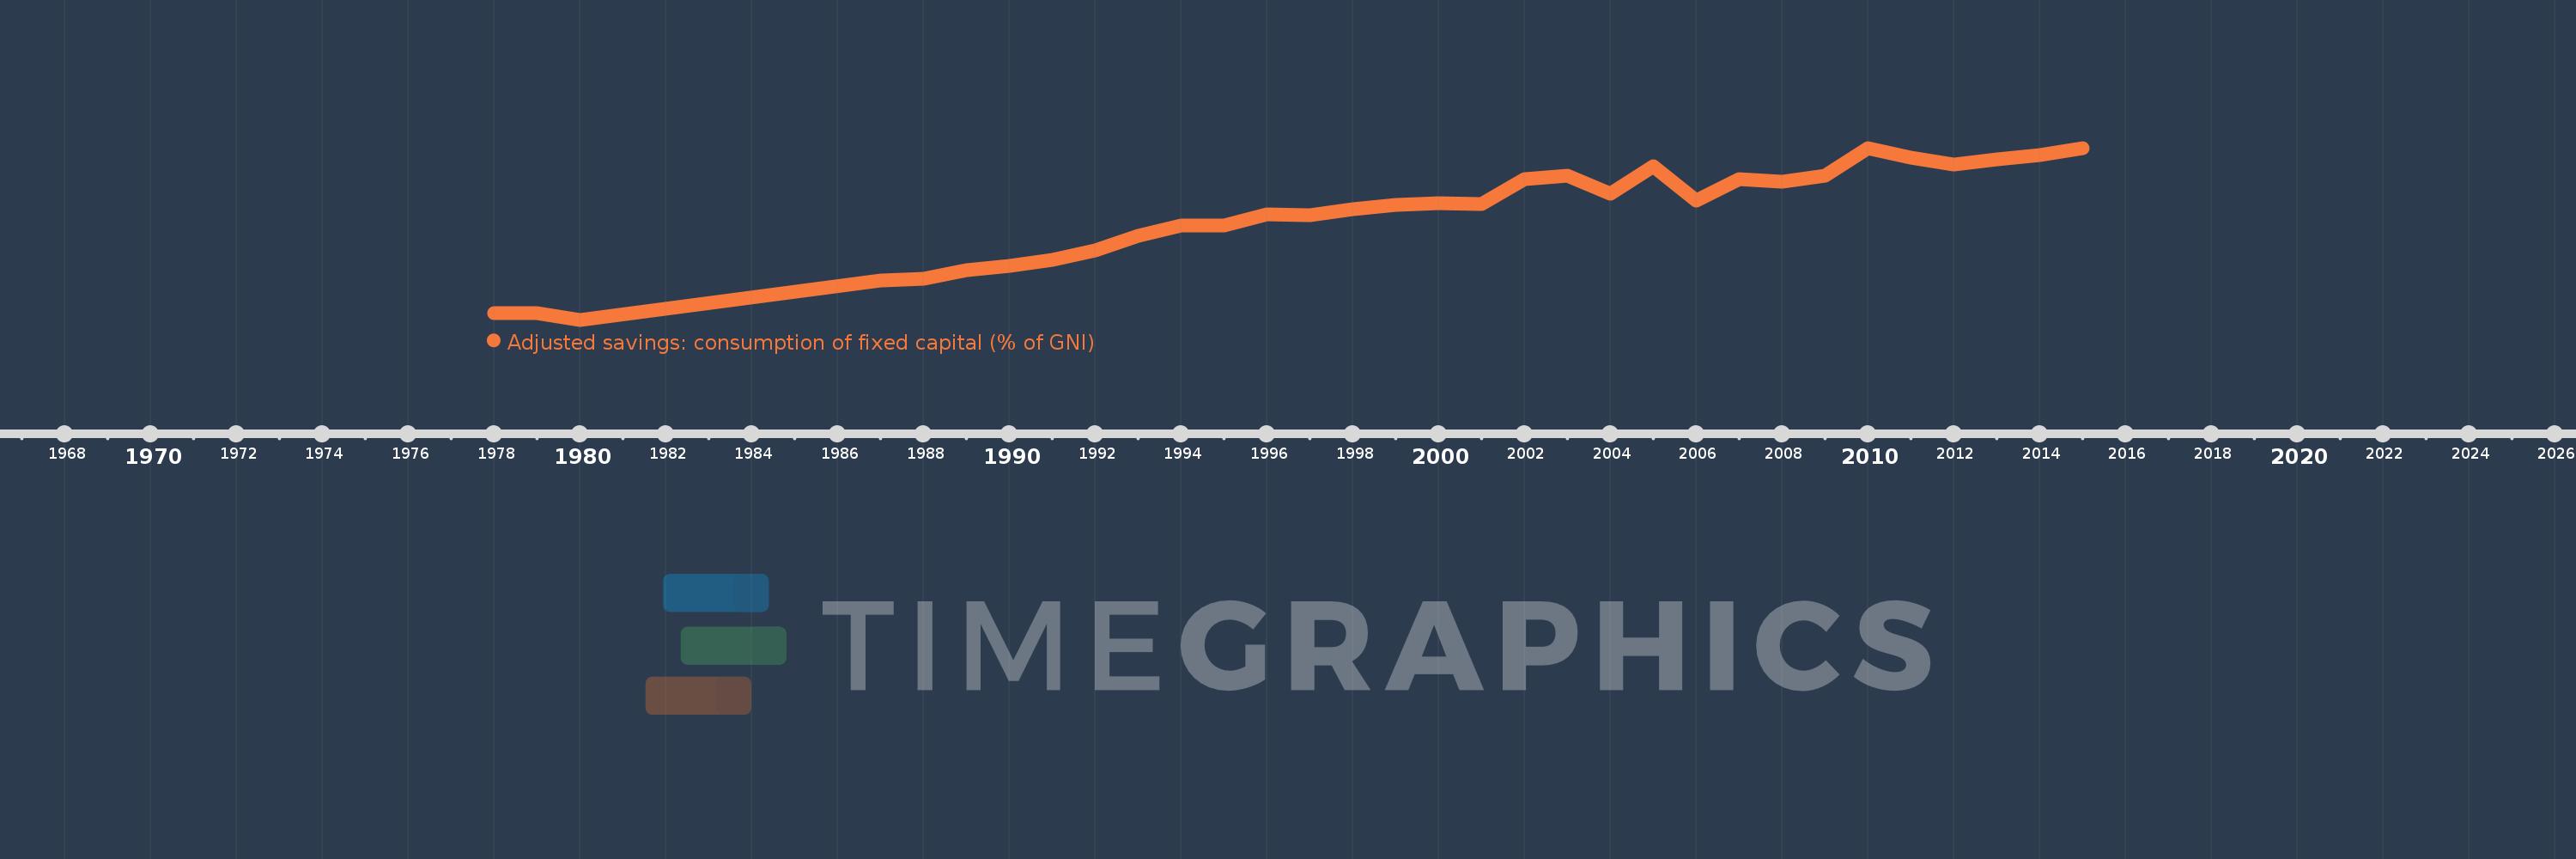
Adjusted savings: consumption of fixed capital (% of GNI)
2015,2014,2013,2012,2011,2010,2009,2008,2007,2006,2005,2004,2003,2002,2001,2000,1999,1998,1997,1996,1995,1994,1993,1992,1991,1990,1989,1988,1987,1980,1979,1978
This statistics in other country:
AfghanistanAlbaniaAlgeriaAndorraAngolaAntigua and BarbudaArab WorldArgentinaArmeniaAustraliaAustriaAzerbaijanBahamas, TheBahrainBangladeshBarbadosBelarusBelgiumBelizeBeninBermudaBhutanBoliviaBosnia and HerzegovinaBotswanaBrazilBrunei DarussalamBulgariaBurkina FasoBurundiCabo VerdeCambodiaCameroonCanadaCaribbean small statesCentral African RepublicCentral Europe and the BalticsChadChileChinaColombiaComorosCongo, Dem. Rep.Congo, Rep.Costa RicaCote d'IvoireCroatiaCubaCyprusCzech RepublicDenmarkDjiboutiDominicaDominican RepublicEarly-demographic dividendEast Asia & PacificEast Asia & Pacific (excluding high income)East Asia & Pacific (IDA & IBRD countries)EcuadorEgypt, Arab Rep.El SalvadorEquatorial GuineaEritreaEstoniaEthiopiaEuro areaEurope & Central AsiaEurope & Central Asia (excluding high income)Europe & Central Asia (IDA & IBRD countries)European UnionFijiFinlandFragile and conflict affected situationsFranceGabonGambia, TheGeorgiaGermanyGhanaGreeceGreenlandGrenadaGuatemalaGuineaGuinea-BissauGuyanaHaitiHeavily indebted poor countries (HIPC)High incomeHondurasHong Kong SAR, ChinaHungaryIBRD onlyIcelandIDA & IBRD totalIDA blendIDA onlyIDA totalIndiaIndonesiaIran, Islamic Rep.IraqIrelandIsraelItalyJamaicaJapanJordanKazakhstanKenyaKiribatiKorea, Rep.KosovoKuwaitKyrgyz RepublicLao PDRLate-demographic dividendLatin America & Caribbean Latin America & Caribbean (excluding high income)Latin America & the Caribbean (IDA & IBRD countries)LatviaLeast developed countries: UN classificationLebanonLesothoLiberiaLibyaLiechtensteinLithuaniaLow & middle incomeLow incomeLower middle incomeLuxembourgMacao SAR, ChinaMacedonia, FYRMadagascarMalawiMalaysiaMaldivesMaliMaltaMarshall IslandsMauritaniaMauritiusMexicoMicronesia, Fed. Sts.Middle East & North AfricaMiddle East & North Africa (excluding high income)Middle East & North Africa (IDA & IBRD countries)Middle incomeMoldovaMonacoMongoliaMontenegroMoroccoMozambiqueMyanmarNamibiaNepalNetherlandsNew ZealandNicaraguaNigerNigeriaNorth AmericaNorwayOECD membersOmanOther small statesPacific island small statesPakistanPalauPanamaPapua New GuineaParaguayPeruPhilippinesPolandPortugalPost-demographic dividendPre-demographic dividendPuerto RicoQatarRomaniaRussian FederationRwandaSamoaSan MarinoSao Tome and PrincipeSaudi ArabiaSenegalSerbiaSeychellesSierra LeoneSingaporeSlovak RepublicSloveniaSmall statesSolomon IslandsSouth AfricaSouth AsiaSouth Asia (IDA & IBRD)SpainSri LankaSt. Kitts and NevisSt. LuciaSt. Vincent and the GrenadinesSub-Saharan Africa Sub-Saharan Africa (excluding high income)Sub-Saharan Africa (IDA & IBRD countries)SudanSurinameSwazilandSwedenSwitzerlandSyrian Arab RepublicTajikistanTanzaniaThailandTimor-LesteTogoTongaTrinidad and TobagoTunisiaTurkeyTurkmenistanTuvaluUgandaUkraineUnited Arab EmiratesUnited KingdomUnited StatesUpper middle incomeUruguayUzbekistanVanuatuVenezuela, RBVietnamWest Bank and GazaWorldYemen, Rep.ZambiaZimbabwe Timeline:
This timeline shows a graph from 1978 to 2015 of Grenada. No data until 1977. Number of actual observations by date: 32.
Source name:
World Development Indicators
Source organization:
World Bank staff estimates using data from the United Nations Statistics Division's National Accounts Statistics.
Categories, topics:
Economy & Growth, Environment
Last updated:
apr 23, 2017
Indicators value changes by year
Maximum:
16.372
jan 1, 2015
At the date of observation
Value
Absolute change
Change from previous value
jan 1, 1978
3.406
+3.406
0.0%
jan 1, 1979
3.455
+0.049
1.42%
jan 1, 1980
2.918
-0.537
-15.54%
jan 1, 1987
6.006
+3.088
105.83%
jan 1, 1988
6.148
+0.142
2.36%
jan 1, 1989
6.797
+0.649
10.56%
jan 1, 1990
7.151
+0.355
5.22%
jan 1, 1991
7.601
+0.45
6.29%
jan 1, 1992
8.344
+0.744
9.78%
jan 1, 1993
9.461
+1.117
13.38%
jan 1, 1994
10.298
+0.837
8.85%
jan 1, 1995
10.286
-0.012
-0.12%
jan 1, 1996
11.146
+0.86
8.36%
jan 1, 1997
11.119
-0.027
-0.24%
jan 1, 1998
11.605
+0.487
4.38%
jan 1, 1999
11.923
+0.318
2.74%
jan 1, 2000
12.063
+0.14
1.17%
jan 1, 2001
11.987
-0.076
-0.63%
jan 1, 2002
13.957
+1.97
16.44%
jan 1, 2003
14.206
+0.249
1.79%
jan 1, 2004
12.808
-1.398
-9.84%
jan 1, 2005
14.943
+2.135
16.67%
jan 1, 2006
12.275
-2.669
-17.86%
jan 1, 2007
13.908
+1.633
13.31%
jan 1, 2008
13.717
-0.191
-1.37%
jan 1, 2009
14.201
+0.484
3.53%
jan 1, 2010
16.332
+2.131
15.01%
jan 1, 2011
15.596
-0.736
-4.51%
jan 1, 2012
15.07
-0.525
-3.37%
jan 1, 2013
15.451
+0.381
2.53%
jan 1, 2014
15.806
+0.354
2.29%
jan 1, 2015
16.372
+0.566
3.58%
Ranking of countries by current statistics by years


Comments: