29
/
en
AIzaSyAYiBZKx7MnpbEhh9jyipgxe19OcubqV5w
April 1, 2024
198694
Mongolia
MNG
true
2
1
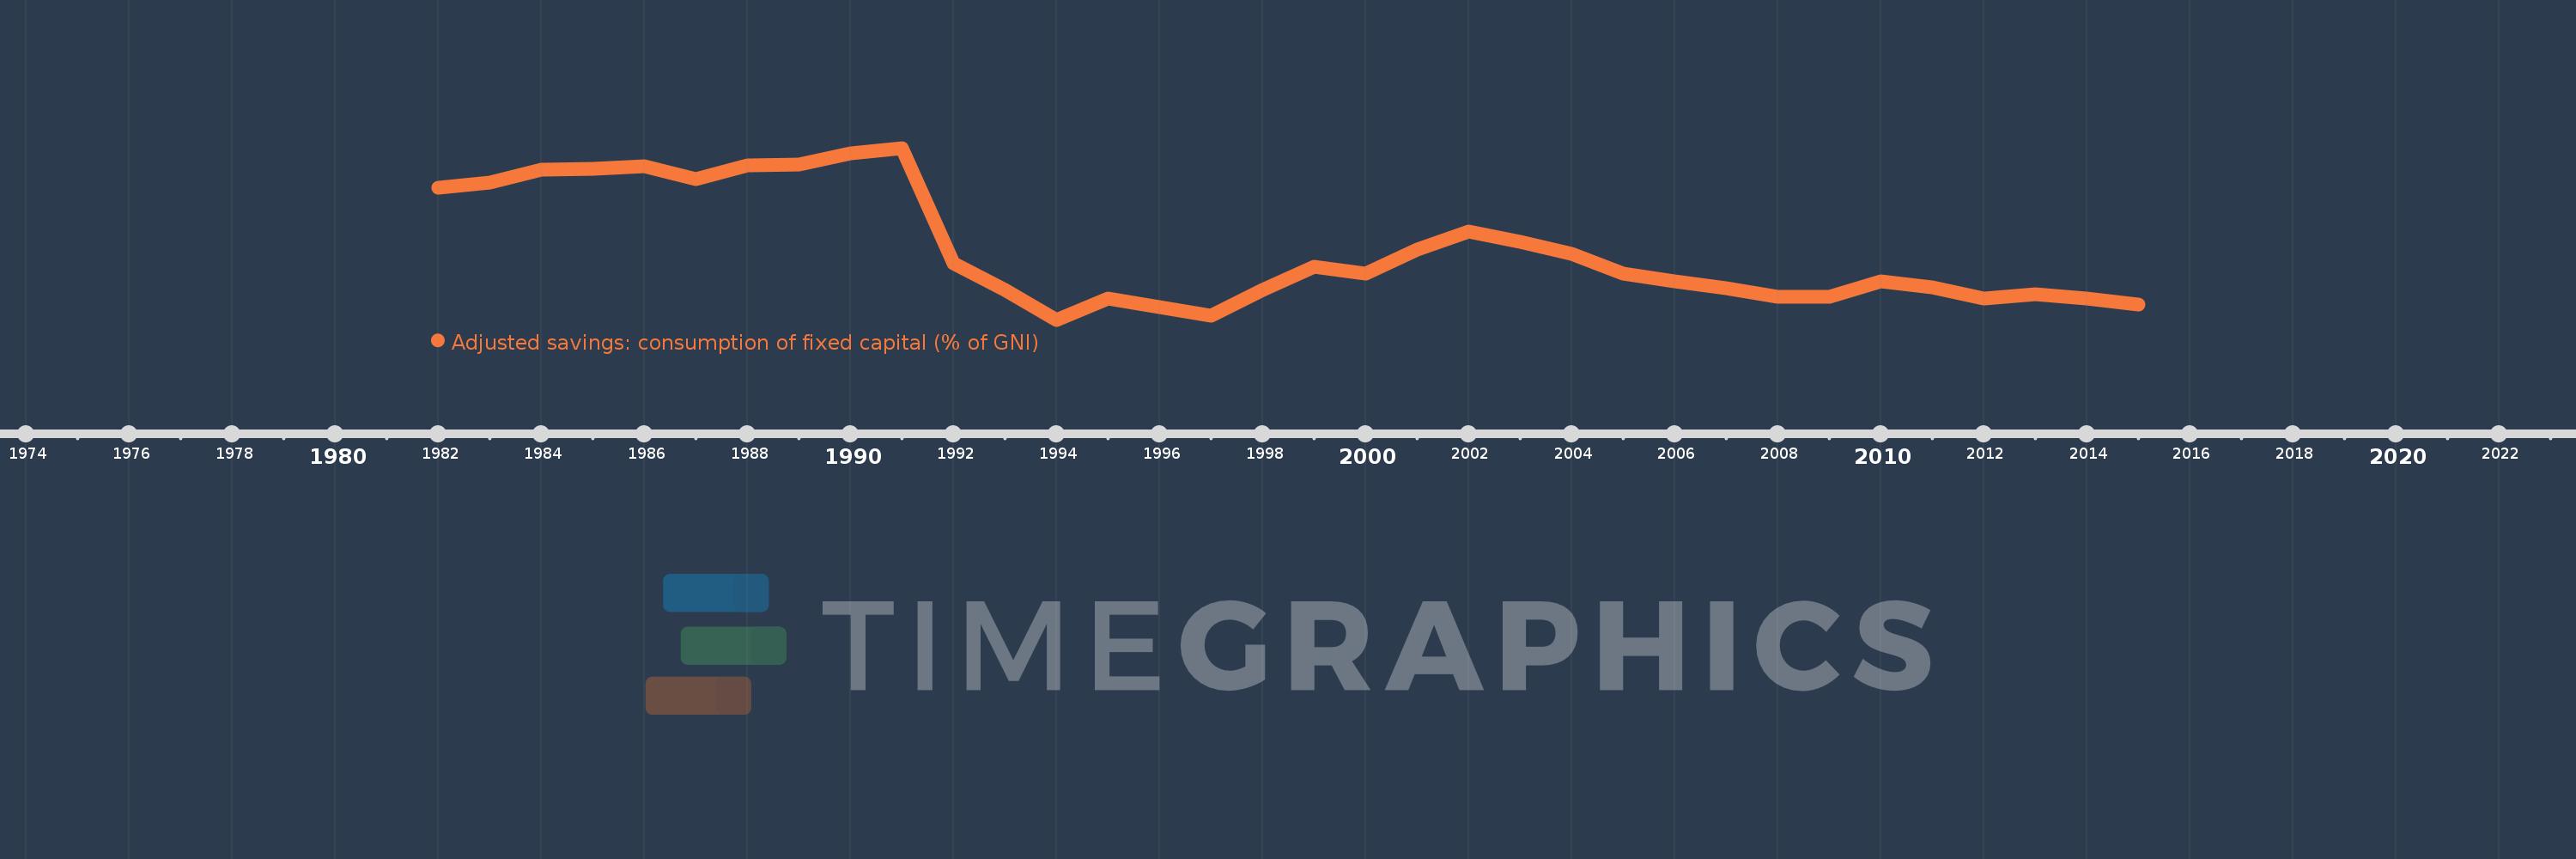
Adjusted savings: consumption of fixed capital (% of GNI)
2015,2014,2013,2012,2011,2010,2009,2008,2007,2006,2005,2004,2003,2002,2001,2000,1999,1998,1997,1996,1995,1994,1993,1992,1991,1990,1989,1988,1987,1986,1985,1984,1983,1982
This statistics in other country:
AfghanistanAlbaniaAlgeriaAndorraAngolaAntigua and BarbudaArab WorldArgentinaArmeniaAustraliaAustriaAzerbaijanBahamas, TheBahrainBangladeshBarbadosBelarusBelgiumBelizeBeninBermudaBhutanBoliviaBosnia and HerzegovinaBotswanaBrazilBrunei DarussalamBulgariaBurkina FasoBurundiCabo VerdeCambodiaCameroonCanadaCaribbean small statesCentral African RepublicCentral Europe and the BalticsChadChileChinaColombiaComorosCongo, Dem. Rep.Congo, Rep.Costa RicaCote d'IvoireCroatiaCubaCyprusCzech RepublicDenmarkDjiboutiDominicaDominican RepublicEarly-demographic dividendEast Asia & PacificEast Asia & Pacific (excluding high income)East Asia & Pacific (IDA & IBRD countries)EcuadorEgypt, Arab Rep.El SalvadorEquatorial GuineaEritreaEstoniaEthiopiaEuro areaEurope & Central AsiaEurope & Central Asia (excluding high income)Europe & Central Asia (IDA & IBRD countries)European UnionFijiFinlandFragile and conflict affected situationsFranceGabonGambia, TheGeorgiaGermanyGhanaGreeceGreenlandGrenadaGuatemalaGuineaGuinea-BissauGuyanaHaitiHeavily indebted poor countries (HIPC)High incomeHondurasHong Kong SAR, ChinaHungaryIBRD onlyIcelandIDA & IBRD totalIDA blendIDA onlyIDA totalIndiaIndonesiaIran, Islamic Rep.IraqIrelandIsraelItalyJamaicaJapanJordanKazakhstanKenyaKiribatiKorea, Rep.KosovoKuwaitKyrgyz RepublicLao PDRLate-demographic dividendLatin America & Caribbean Latin America & Caribbean (excluding high income)Latin America & the Caribbean (IDA & IBRD countries)LatviaLeast developed countries: UN classificationLebanonLesothoLiberiaLibyaLiechtensteinLithuaniaLow & middle incomeLow incomeLower middle incomeLuxembourgMacao SAR, ChinaMacedonia, FYRMadagascarMalawiMalaysiaMaldivesMaliMaltaMarshall IslandsMauritaniaMauritiusMexicoMicronesia, Fed. Sts.Middle East & North AfricaMiddle East & North Africa (excluding high income)Middle East & North Africa (IDA & IBRD countries)Middle incomeMoldovaMonacoMongoliaMontenegroMoroccoMozambiqueMyanmarNamibiaNepalNetherlandsNew ZealandNicaraguaNigerNigeriaNorth AmericaNorwayOECD membersOmanOther small statesPacific island small statesPakistanPalauPanamaPapua New GuineaParaguayPeruPhilippinesPolandPortugalPost-demographic dividendPre-demographic dividendPuerto RicoQatarRomaniaRussian FederationRwandaSamoaSan MarinoSao Tome and PrincipeSaudi ArabiaSenegalSerbiaSeychellesSierra LeoneSingaporeSlovak RepublicSloveniaSmall statesSolomon IslandsSouth AfricaSouth AsiaSouth Asia (IDA & IBRD)SpainSri LankaSt. Kitts and NevisSt. LuciaSt. Vincent and the GrenadinesSub-Saharan Africa Sub-Saharan Africa (excluding high income)Sub-Saharan Africa (IDA & IBRD countries)SudanSurinameSwazilandSwedenSwitzerlandSyrian Arab RepublicTajikistanTanzaniaThailandTimor-LesteTogoTongaTrinidad and TobagoTunisiaTurkeyTurkmenistanTuvaluUgandaUkraineUnited Arab EmiratesUnited KingdomUnited StatesUpper middle incomeUruguayUzbekistanVanuatuVenezuela, RBVietnamWest Bank and GazaWorldYemen, Rep.ZambiaZimbabwe Timeline:
This timeline shows a graph from 1982 to 2015 of Mongolia. No data until 1981. Number of actual observations by date: 34.
Source name:
World Development Indicators
Source organization:
World Bank staff estimates using data from the United Nations Statistics Division's National Accounts Statistics.
Categories, topics:
Economy & Growth, Environment
Last updated:
apr 23, 2017
Indicators value changes by year
Maximum:
20.879
jan 1, 1991
At the date of observation
Value
Absolute change
Change from previous value
jan 1, 1982
17.148
+17.148
0.0%
jan 1, 1983
17.594
+0.447
2.6%
jan 1, 1984
18.845
+1.25
7.11%
jan 1, 1985
18.938
+0.094
0.5%
jan 1, 1986
19.178
+0.24
1.27%
jan 1, 1987
17.924
-1.254
-6.54%
jan 1, 1988
19.225
+1.301
7.26%
jan 1, 1989
19.338
+0.113
0.59%
jan 1, 1990
20.329
+0.991
5.12%
jan 1, 1991
20.879
+0.551
2.71%
jan 1, 1992
9.95
-10.93
-52.35%
jan 1, 1993
7.406
-2.543
-25.56%
jan 1, 1994
4.623
-2.783
-37.58%
jan 1, 1995
6.617
+1.994
43.12%
jan 1, 1996
5.85
-0.766
-11.58%
jan 1, 1997
5.001
-0.85
-14.53%
jan 1, 1998
7.474
+2.473
49.45%
jan 1, 1999
9.625
+2.151
28.78%
jan 1, 2000
8.992
-0.633
-6.57%
jan 1, 2001
11.289
+2.296
25.54%
jan 1, 2002
13.006
+1.717
15.21%
jan 1, 2003
11.963
-1.044
-8.02%
jan 1, 2004
10.851
-1.112
-9.29%
jan 1, 2005
8.97
-1.881
-17.33%
jan 1, 2006
8.232
-0.738
-8.23%
jan 1, 2007
7.612
-0.62
-7.54%
jan 1, 2008
6.753
-0.858
-11.27%
jan 1, 2009
6.762
+0.008
0.12%
jan 1, 2010
8.274
+1.512
22.36%
jan 1, 2011
7.67
-0.603
-7.29%
jan 1, 2012
6.595
-1.075
-14.02%
jan 1, 2013
7.056
+0.461
6.99%
jan 1, 2014
6.665
-0.391
-5.54%
jan 1, 2015
6.101
-0.564
-8.46%
Ranking of countries by current statistics by years


Comments: