29
/
en
AIzaSyAYiBZKx7MnpbEhh9jyipgxe19OcubqV5w
April 1, 2024
184774
Madagascar
MDG
true
2
1
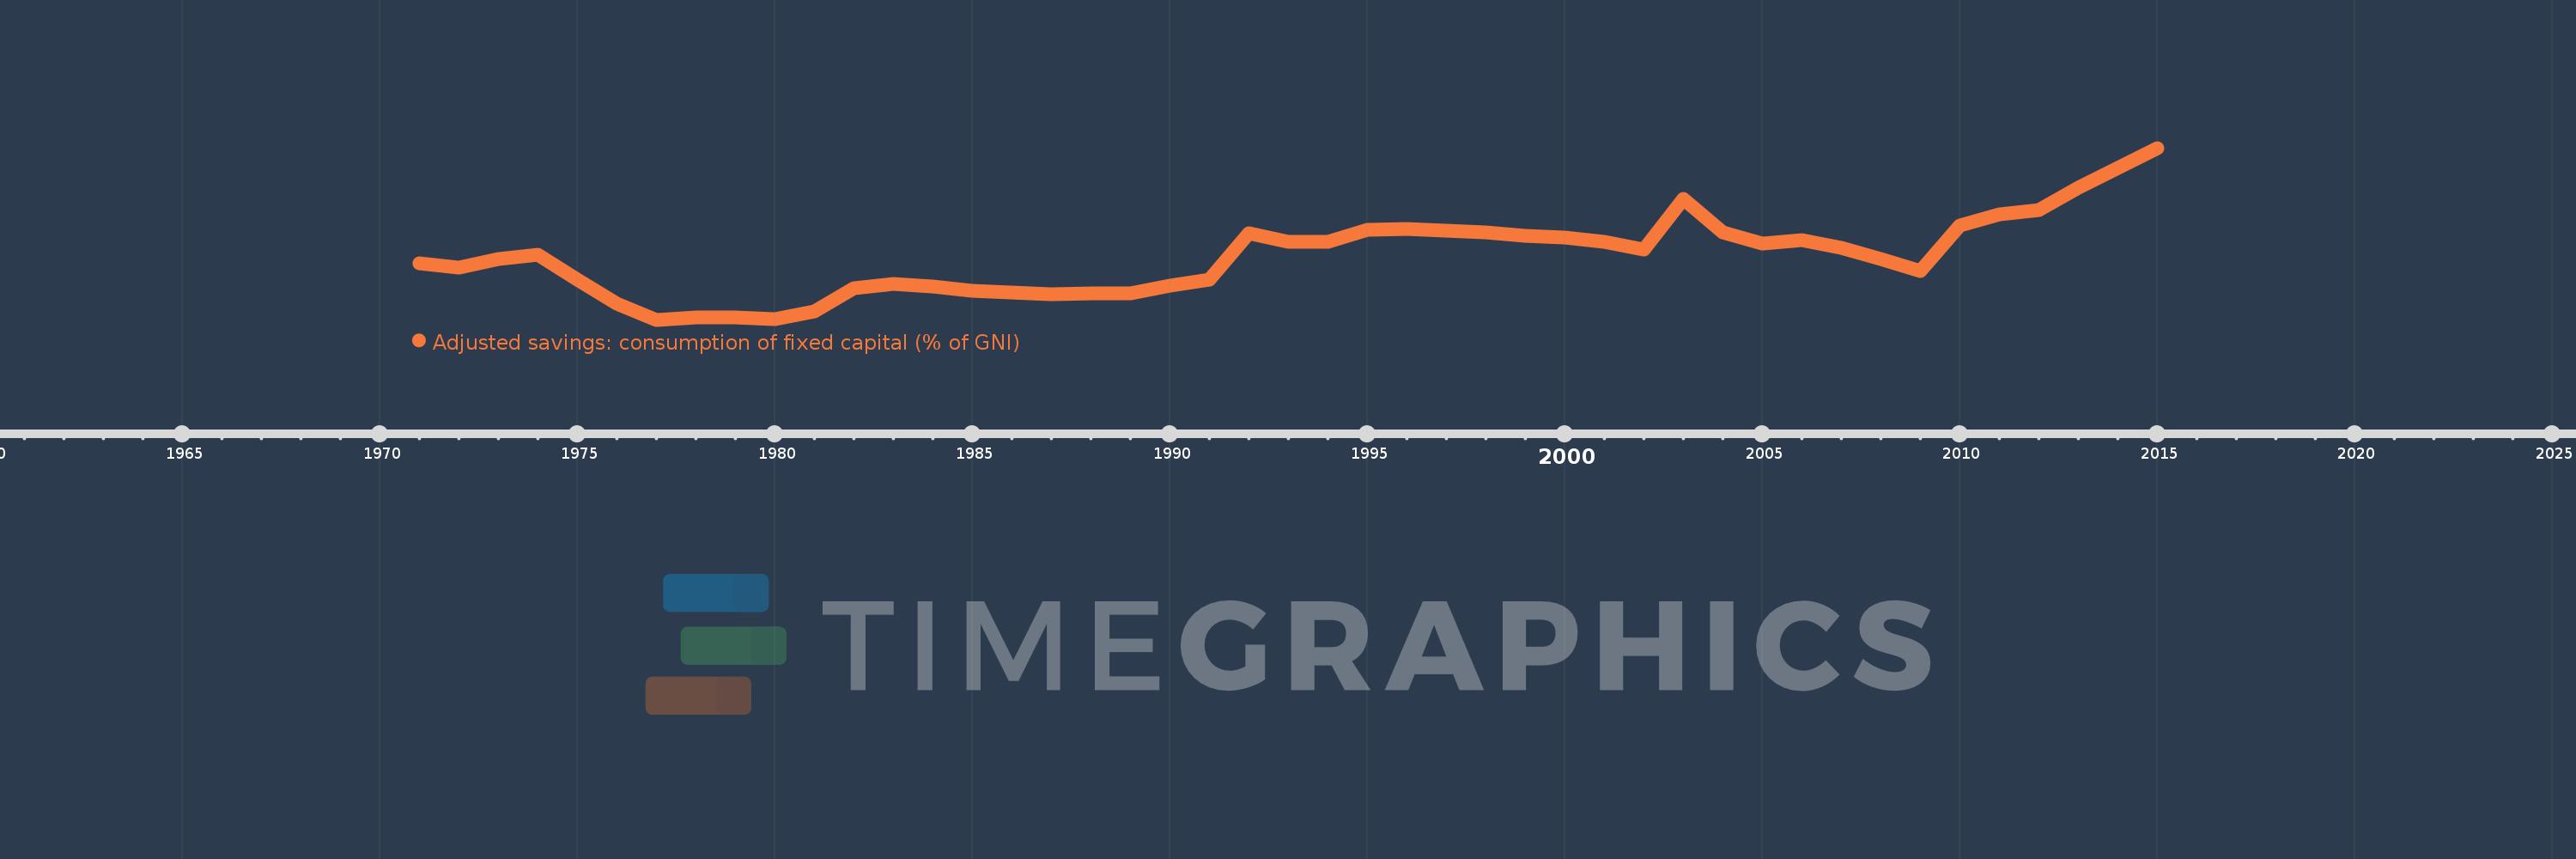
Adjusted savings: consumption of fixed capital (% of GNI)
2015,2014,2013,2012,2011,2010,2009,2008,2007,2006,2005,2004,2003,2002,2001,2000,1999,1998,1997,1996,1995,1994,1993,1992,1991,1990,1989,1988,1987,1986,1985,1984,1983,1982,1981,1980,1979,1978,1977,1976,1975,1974,1973,1972,1971
This statistics in other country:
AfghanistanAlbaniaAlgeriaAndorraAngolaAntigua and BarbudaArab WorldArgentinaArmeniaAustraliaAustriaAzerbaijanBahamas, TheBahrainBangladeshBarbadosBelarusBelgiumBelizeBeninBermudaBhutanBoliviaBosnia and HerzegovinaBotswanaBrazilBrunei DarussalamBulgariaBurkina FasoBurundiCabo VerdeCambodiaCameroonCanadaCaribbean small statesCentral African RepublicCentral Europe and the BalticsChadChileChinaColombiaComorosCongo, Dem. Rep.Congo, Rep.Costa RicaCote d'IvoireCroatiaCubaCyprusCzech RepublicDenmarkDjiboutiDominicaDominican RepublicEarly-demographic dividendEast Asia & PacificEast Asia & Pacific (excluding high income)East Asia & Pacific (IDA & IBRD countries)EcuadorEgypt, Arab Rep.El SalvadorEquatorial GuineaEritreaEstoniaEthiopiaEuro areaEurope & Central AsiaEurope & Central Asia (excluding high income)Europe & Central Asia (IDA & IBRD countries)European UnionFijiFinlandFragile and conflict affected situationsFranceGabonGambia, TheGeorgiaGermanyGhanaGreeceGreenlandGrenadaGuatemalaGuineaGuinea-BissauGuyanaHaitiHeavily indebted poor countries (HIPC)High incomeHondurasHong Kong SAR, ChinaHungaryIBRD onlyIcelandIDA & IBRD totalIDA blendIDA onlyIDA totalIndiaIndonesiaIran, Islamic Rep.IraqIrelandIsraelItalyJamaicaJapanJordanKazakhstanKenyaKiribatiKorea, Rep.KosovoKuwaitKyrgyz RepublicLao PDRLate-demographic dividendLatin America & Caribbean Latin America & Caribbean (excluding high income)Latin America & the Caribbean (IDA & IBRD countries)LatviaLeast developed countries: UN classificationLebanonLesothoLiberiaLibyaLiechtensteinLithuaniaLow & middle incomeLow incomeLower middle incomeLuxembourgMacao SAR, ChinaMacedonia, FYRMadagascarMalawiMalaysiaMaldivesMaliMaltaMarshall IslandsMauritaniaMauritiusMexicoMicronesia, Fed. Sts.Middle East & North AfricaMiddle East & North Africa (excluding high income)Middle East & North Africa (IDA & IBRD countries)Middle incomeMoldovaMonacoMongoliaMontenegroMoroccoMozambiqueMyanmarNamibiaNepalNetherlandsNew ZealandNicaraguaNigerNigeriaNorth AmericaNorwayOECD membersOmanOther small statesPacific island small statesPakistanPalauPanamaPapua New GuineaParaguayPeruPhilippinesPolandPortugalPost-demographic dividendPre-demographic dividendPuerto RicoQatarRomaniaRussian FederationRwandaSamoaSan MarinoSao Tome and PrincipeSaudi ArabiaSenegalSerbiaSeychellesSierra LeoneSingaporeSlovak RepublicSloveniaSmall statesSolomon IslandsSouth AfricaSouth AsiaSouth Asia (IDA & IBRD)SpainSri LankaSt. Kitts and NevisSt. LuciaSt. Vincent and the GrenadinesSub-Saharan Africa Sub-Saharan Africa (excluding high income)Sub-Saharan Africa (IDA & IBRD countries)SudanSurinameSwazilandSwedenSwitzerlandSyrian Arab RepublicTajikistanTanzaniaThailandTimor-LesteTogoTongaTrinidad and TobagoTunisiaTurkeyTurkmenistanTuvaluUgandaUkraineUnited Arab EmiratesUnited KingdomUnited StatesUpper middle incomeUruguayUzbekistanVanuatuVenezuela, RBVietnamWest Bank and GazaWorldYemen, Rep.ZambiaZimbabwe Timeline:
This timeline shows a graph from 1971 to 2015 of Madagascar. No data until 1970. Number of actual observations by date: 45.
Source name:
World Development Indicators
Source organization:
World Bank staff estimates using data from the United Nations Statistics Division's National Accounts Statistics.
Categories, topics:
Economy & Growth, Environment
Last updated:
apr 23, 2017
Indicators value changes by year
At the date of observation
Value
Absolute change
Change from previous value
jan 1, 1971
3.801
+3.801
0.0%
jan 1, 1972
3.588
-0.213
-5.61%
jan 1, 1973
4.0
+0.412
11.48%
jan 1, 1974
4.17
+0.171
4.27%
jan 1, 1975
3.007
-1.164
-27.9%
jan 1, 1976
1.908
-1.099
-36.54%
jan 1, 1977
1.147
-0.761
-39.9%
jan 1, 1978
1.24
+0.093
8.15%
jan 1, 1979
1.274
+0.034
2.7%
jan 1, 1980
1.181
-0.093
-7.29%
jan 1, 1981
1.535
+0.355
30.03%
jan 1, 1982
2.613
+1.078
70.2%
jan 1, 1983
2.833
+0.22
8.41%
jan 1, 1984
2.683
-0.15
-5.28%
jan 1, 1985
2.488
-0.195
-7.26%
jan 1, 1986
2.412
-0.076
-3.06%
jan 1, 1987
2.325
-0.087
-3.62%
jan 1, 1988
2.361
+0.037
1.57%
jan 1, 1989
2.382
+0.021
0.89%
jan 1, 1990
2.728
+0.345
14.49%
jan 1, 1991
3.005
+0.277
10.17%
jan 1, 1992
5.201
+2.196
73.06%
jan 1, 1993
4.767
-0.433
-8.33%
jan 1, 1994
4.796
+0.028
0.59%
jan 1, 1995
5.346
+0.551
11.49%
jan 1, 1996
5.4
+0.053
0.99%
jan 1, 1997
5.312
-0.087
-1.61%
jan 1, 1998
5.227
-0.085
-1.6%
jan 1, 1999
5.068
-0.159
-3.05%
jan 1, 2000
4.99
-0.078
-1.53%
jan 1, 2001
4.776
-0.215
-4.3%
jan 1, 2002
4.42
-0.355
-7.44%
jan 1, 2003
6.773
+2.353
53.23%
jan 1, 2004
5.207
-1.566
-23.12%
jan 1, 2005
4.712
-0.496
-9.52%
jan 1, 2006
4.881
+0.169
3.59%
jan 1, 2007
4.51
-0.371
-7.6%
jan 1, 2008
3.998
-0.512
-11.35%
jan 1, 2009
3.423
-0.575
-14.37%
jan 1, 2010
5.548
+2.125
62.07%
jan 1, 2011
6.057
+0.509
9.17%
jan 1, 2012
6.254
+0.197
3.25%
jan 1, 2013
7.305
+1.051
16.8%
jan 1, 2014
8.251
+0.946
12.95%
jan 1, 2015
9.166
+0.915
11.09%
Ranking of countries by current statistics by years


Comments: