29
/
en
AIzaSyAYiBZKx7MnpbEhh9jyipgxe19OcubqV5w
April 1, 2024
149923
Honduras
HND
true
2
1
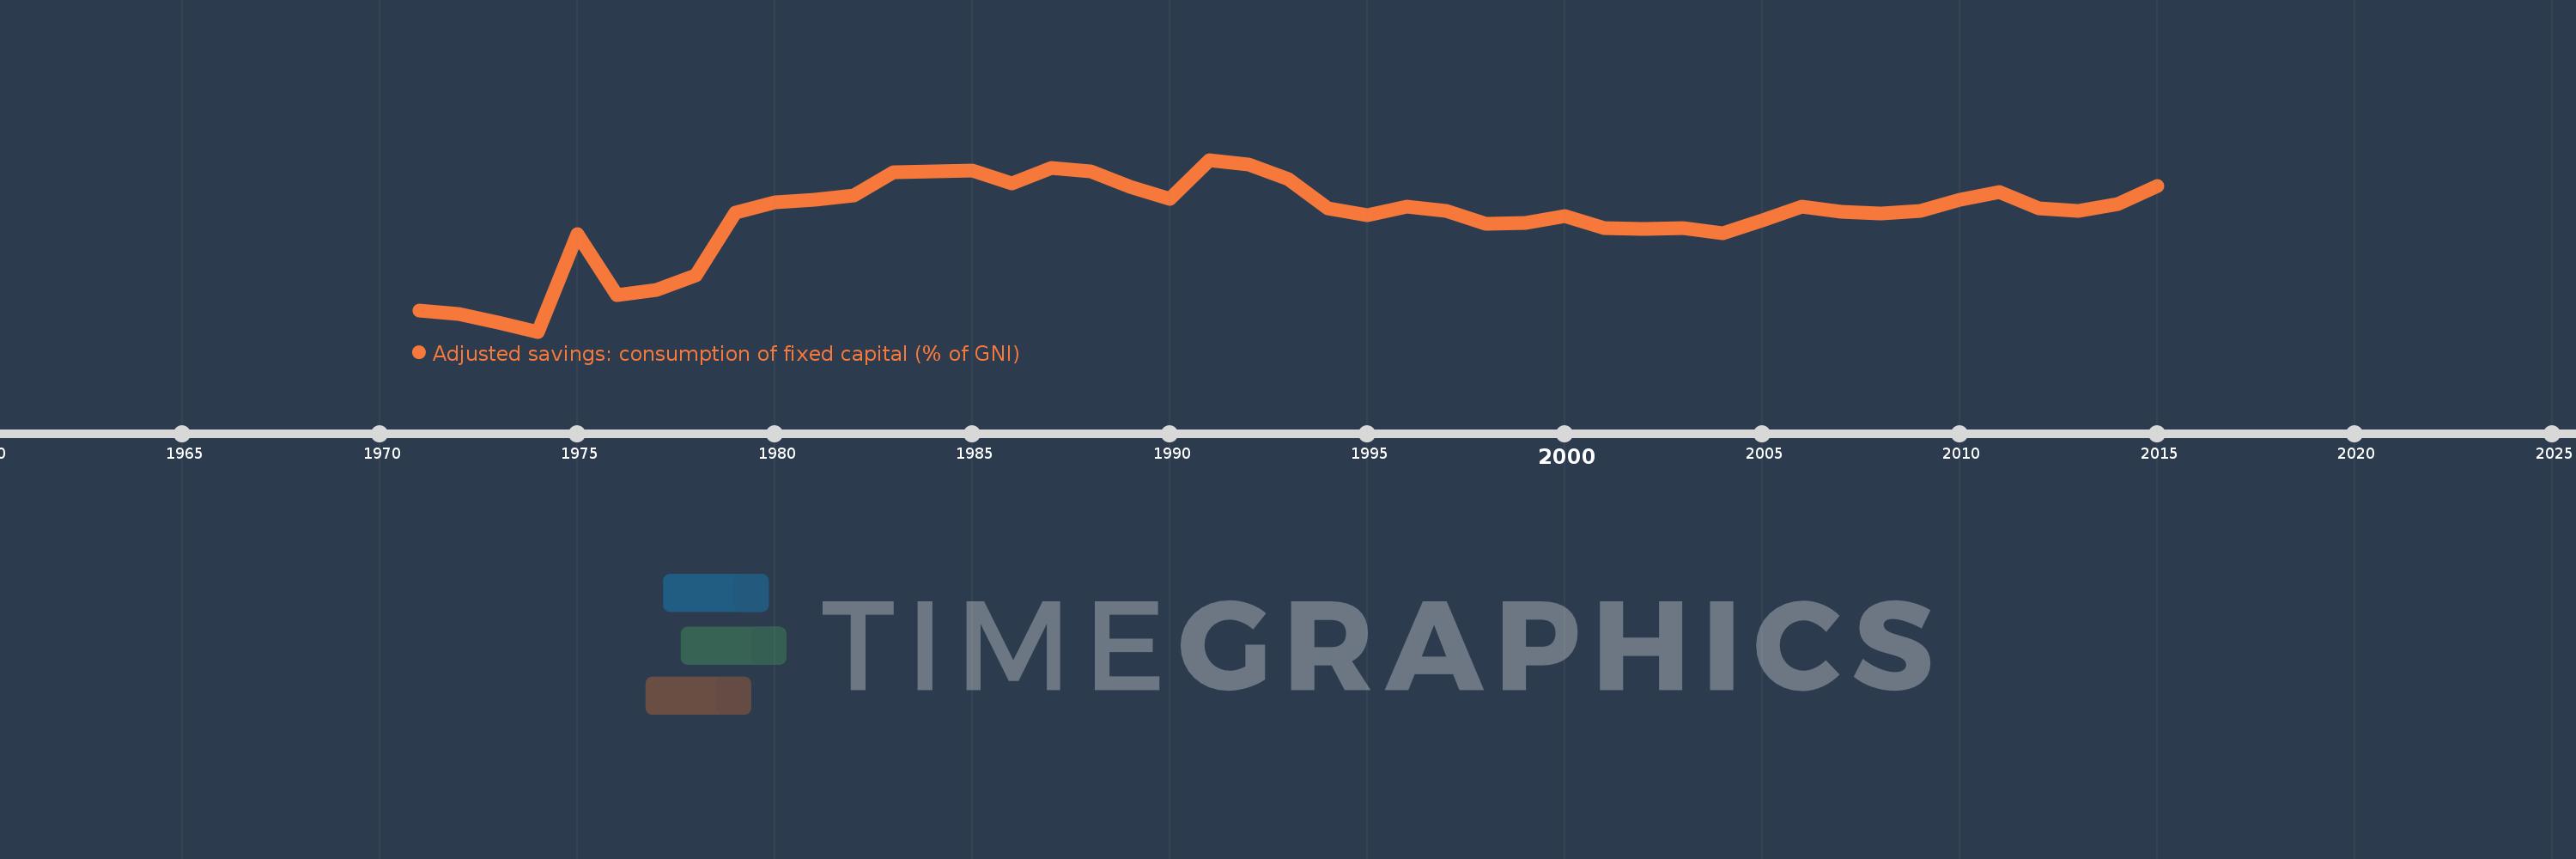
Adjusted savings: consumption of fixed capital (% of GNI)
2015,2014,2013,2012,2011,2010,2009,2008,2007,2006,2005,2004,2003,2002,2001,2000,1999,1998,1997,1996,1995,1994,1993,1992,1991,1990,1989,1988,1987,1986,1985,1984,1983,1982,1981,1980,1979,1978,1977,1976,1975,1974,1973,1972,1971
This statistics in other country:
AfghanistanAlbaniaAlgeriaAndorraAngolaAntigua and BarbudaArab WorldArgentinaArmeniaAustraliaAustriaAzerbaijanBahamas, TheBahrainBangladeshBarbadosBelarusBelgiumBelizeBeninBermudaBhutanBoliviaBosnia and HerzegovinaBotswanaBrazilBrunei DarussalamBulgariaBurkina FasoBurundiCabo VerdeCambodiaCameroonCanadaCaribbean small statesCentral African RepublicCentral Europe and the BalticsChadChileChinaColombiaComorosCongo, Dem. Rep.Congo, Rep.Costa RicaCote d'IvoireCroatiaCubaCyprusCzech RepublicDenmarkDjiboutiDominicaDominican RepublicEarly-demographic dividendEast Asia & PacificEast Asia & Pacific (excluding high income)East Asia & Pacific (IDA & IBRD countries)EcuadorEgypt, Arab Rep.El SalvadorEquatorial GuineaEritreaEstoniaEthiopiaEuro areaEurope & Central AsiaEurope & Central Asia (excluding high income)Europe & Central Asia (IDA & IBRD countries)European UnionFijiFinlandFragile and conflict affected situationsFranceGabonGambia, TheGeorgiaGermanyGhanaGreeceGreenlandGrenadaGuatemalaGuineaGuinea-BissauGuyanaHaitiHeavily indebted poor countries (HIPC)High incomeHondurasHong Kong SAR, ChinaHungaryIBRD onlyIcelandIDA & IBRD totalIDA blendIDA onlyIDA totalIndiaIndonesiaIran, Islamic Rep.IraqIrelandIsraelItalyJamaicaJapanJordanKazakhstanKenyaKiribatiKorea, Rep.KosovoKuwaitKyrgyz RepublicLao PDRLate-demographic dividendLatin America & Caribbean Latin America & Caribbean (excluding high income)Latin America & the Caribbean (IDA & IBRD countries)LatviaLeast developed countries: UN classificationLebanonLesothoLiberiaLibyaLiechtensteinLithuaniaLow & middle incomeLow incomeLower middle incomeLuxembourgMacao SAR, ChinaMacedonia, FYRMadagascarMalawiMalaysiaMaldivesMaliMaltaMarshall IslandsMauritaniaMauritiusMexicoMicronesia, Fed. Sts.Middle East & North AfricaMiddle East & North Africa (excluding high income)Middle East & North Africa (IDA & IBRD countries)Middle incomeMoldovaMonacoMongoliaMontenegroMoroccoMozambiqueMyanmarNamibiaNepalNetherlandsNew ZealandNicaraguaNigerNigeriaNorth AmericaNorwayOECD membersOmanOther small statesPacific island small statesPakistanPalauPanamaPapua New GuineaParaguayPeruPhilippinesPolandPortugalPost-demographic dividendPre-demographic dividendPuerto RicoQatarRomaniaRussian FederationRwandaSamoaSan MarinoSao Tome and PrincipeSaudi ArabiaSenegalSerbiaSeychellesSierra LeoneSingaporeSlovak RepublicSloveniaSmall statesSolomon IslandsSouth AfricaSouth AsiaSouth Asia (IDA & IBRD)SpainSri LankaSt. Kitts and NevisSt. LuciaSt. Vincent and the GrenadinesSub-Saharan Africa Sub-Saharan Africa (excluding high income)Sub-Saharan Africa (IDA & IBRD countries)SudanSurinameSwazilandSwedenSwitzerlandSyrian Arab RepublicTajikistanTanzaniaThailandTimor-LesteTogoTongaTrinidad and TobagoTunisiaTurkeyTurkmenistanTuvaluUgandaUkraineUnited Arab EmiratesUnited KingdomUnited StatesUpper middle incomeUruguayUzbekistanVanuatuVenezuela, RBVietnamWest Bank and GazaWorldYemen, Rep.ZambiaZimbabwe Timeline:
This timeline shows a graph from 1971 to 2015 of Honduras. No data until 1970. Number of actual observations by date: 45.
Source name:
World Development Indicators
Source organization:
World Bank staff estimates using data from the United Nations Statistics Division's National Accounts Statistics.
Categories, topics:
Economy & Growth, Environment
Last updated:
apr 23, 2017
Indicators value changes by year
At the date of observation
Value
Absolute change
Change from previous value
jan 1, 1971
3.346
+3.346
0.0%
jan 1, 1972
3.278
-0.068
-2.03%
jan 1, 1973
3.06
-0.218
-6.64%
jan 1, 1974
2.852
-0.208
-6.81%
jan 1, 1975
5.177
+2.325
81.53%
jan 1, 1976
3.729
-1.449
-27.98%
jan 1, 1977
3.837
+0.108
2.91%
jan 1, 1978
4.192
+0.355
9.24%
jan 1, 1979
5.675
+1.483
35.39%
jan 1, 1980
5.923
+0.248
4.37%
jan 1, 1981
5.982
+0.059
0.99%
jan 1, 1982
6.081
+0.099
1.65%
jan 1, 1983
6.631
+0.55
9.05%
jan 1, 1984
6.652
+0.021
0.32%
jan 1, 1985
6.676
+0.024
0.36%
jan 1, 1986
6.382
-0.294
-4.41%
jan 1, 1987
6.747
+0.365
5.71%
jan 1, 1988
6.658
-0.088
-1.31%
jan 1, 1989
6.297
-0.362
-5.43%
jan 1, 1990
6.015
-0.282
-4.48%
jan 1, 1991
6.935
+0.921
15.31%
jan 1, 1992
6.831
-0.105
-1.51%
jan 1, 1993
6.481
-0.35
-5.12%
jan 1, 1994
5.782
-0.698
-10.78%
jan 1, 1995
5.623
-0.159
-2.75%
jan 1, 1996
5.817
+0.194
3.44%
jan 1, 1997
5.73
-0.087
-1.5%
jan 1, 1998
5.406
-0.324
-5.65%
jan 1, 1999
5.425
+0.019
0.36%
jan 1, 2000
5.602
+0.177
3.25%
jan 1, 2001
5.313
-0.289
-5.16%
jan 1, 2002
5.286
-0.027
-0.5%
jan 1, 2003
5.302
+0.016
0.3%
jan 1, 2004
5.189
-0.112
-2.12%
jan 1, 2005
5.502
+0.312
6.02%
jan 1, 2006
5.83
+0.328
5.97%
jan 1, 2007
5.704
-0.126
-2.16%
jan 1, 2008
5.664
-0.04
-0.71%
jan 1, 2009
5.713
+0.049
0.87%
jan 1, 2010
5.976
+0.262
4.59%
jan 1, 2011
6.169
+0.193
3.23%
jan 1, 2012
5.787
-0.382
-6.2%
jan 1, 2013
5.73
-0.057
-0.98%
jan 1, 2014
5.893
+0.164
2.86%
jan 1, 2015
6.321
+0.427
7.25%
Ranking of countries by current statistics by years


Comments: