29
/
en
AIzaSyAYiBZKx7MnpbEhh9jyipgxe19OcubqV5w
April 1, 2024
94015
Bulgaria
BGR
true
2
1
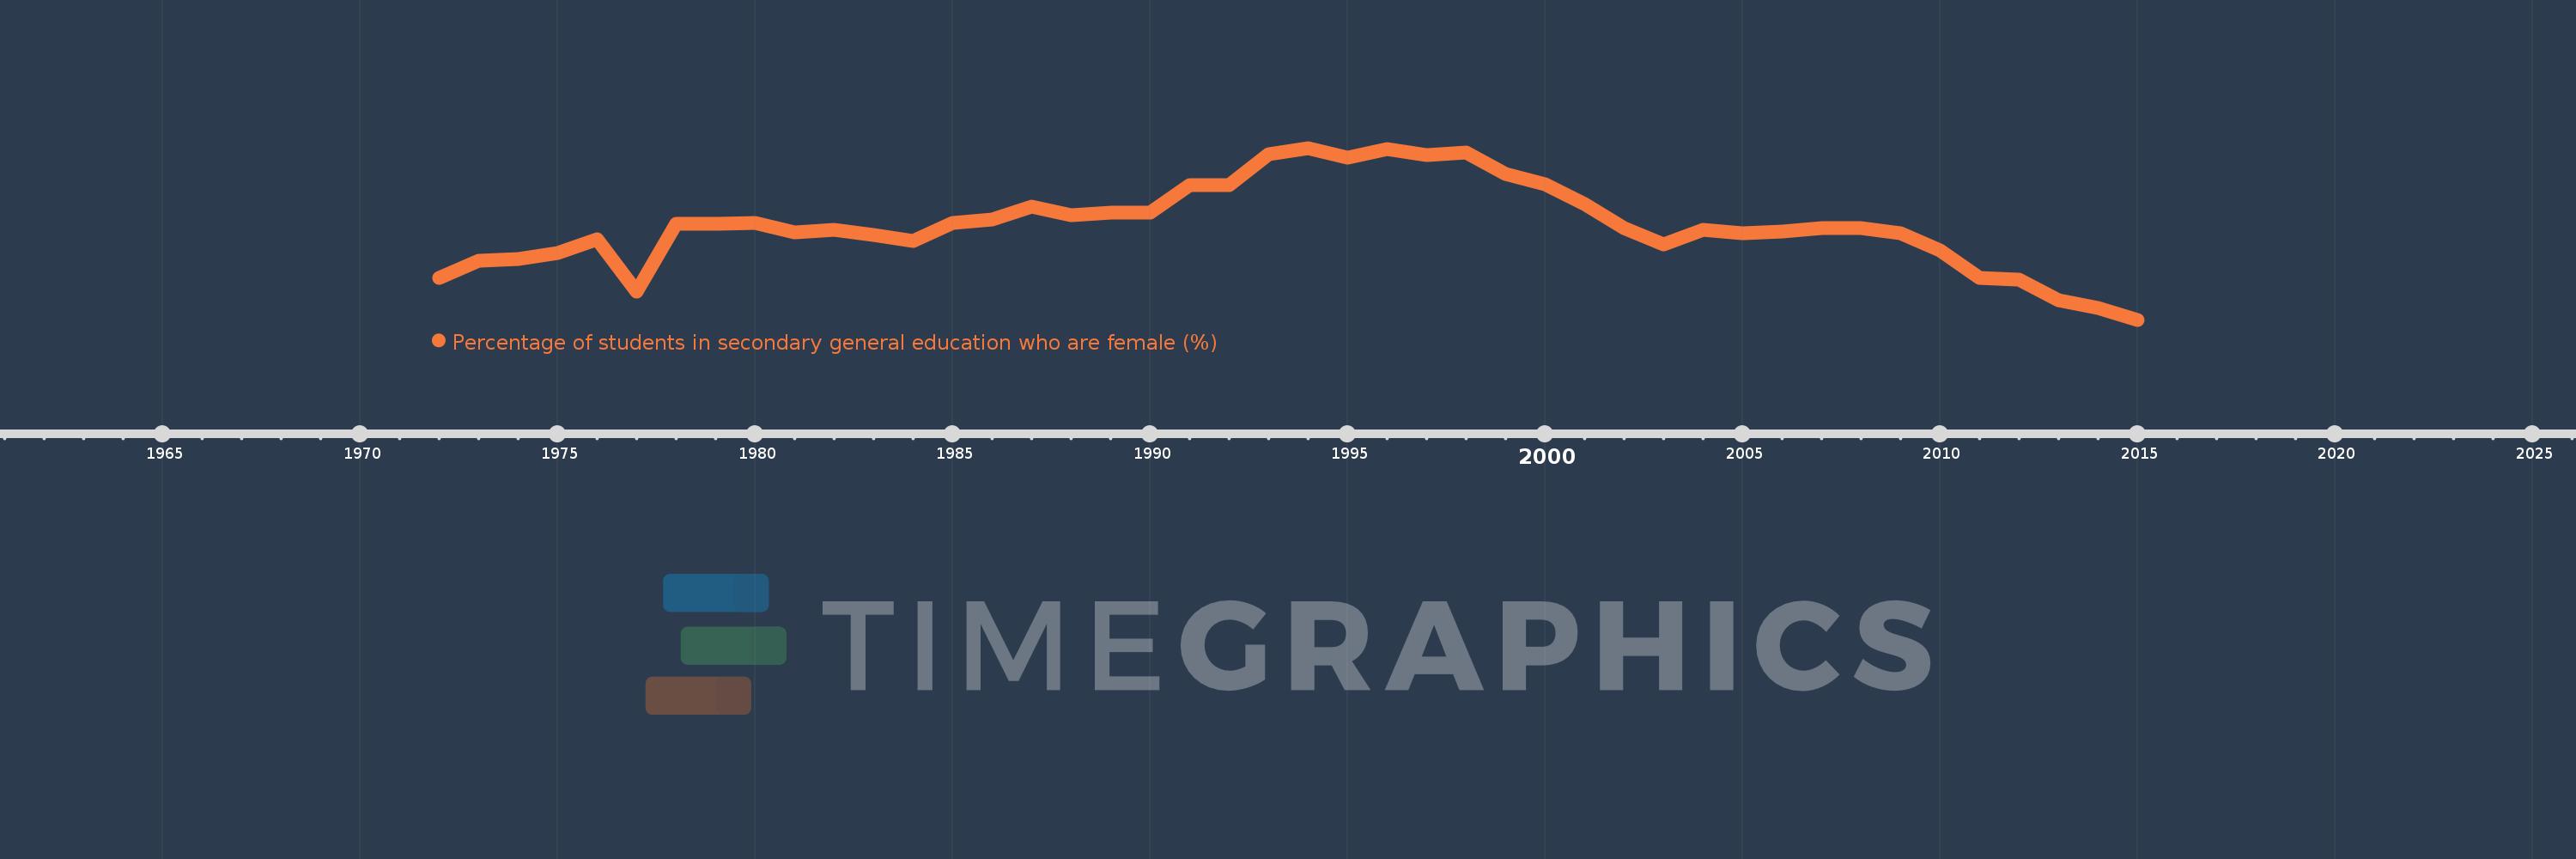
Percentage of students in secondary general education who are female (%)
2015,2014,2013,2012,2011,2010,2009,2008,2007,2006,2005,2004,2003,2002,2001,2000,1999,1998,1997,1996,1995,1994,1993,1992,1991,1990,1989,1988,1987,1986,1985,1984,1983,1982,1981,1980,1979,1978,1977,1976,1975,1974,1973,1972
This statistics in other country:
AfghanistanAlbaniaAlgeriaAndorraAngolaAntigua and BarbudaArab WorldArgentinaArmeniaArubaAustraliaAustriaAzerbaijanBahamas, TheBahrainBangladeshBarbadosBelarusBelgiumBelizeBeninBermudaBhutanBoliviaBosnia and HerzegovinaBotswanaBrazilBritish Virgin IslandsBrunei DarussalamBulgariaBurkina FasoBurundiCabo VerdeCambodiaCameroonCanadaCaribbean small statesCayman IslandsCentral African RepublicCentral Europe and the BalticsChadChileChinaColombiaComorosCongo, Dem. Rep.Congo, Rep.Costa RicaCote d'IvoireCroatiaCubaCuracaoCyprusCzech RepublicDenmarkDjiboutiDominicaDominican RepublicEarly-demographic dividendEast Asia & PacificEast Asia & Pacific (excluding high income)East Asia & Pacific (IDA & IBRD countries)EcuadorEgypt, Arab Rep.El SalvadorEquatorial GuineaEritreaEstoniaEthiopiaEuro areaEurope & Central AsiaEurope & Central Asia (excluding high income)Europe & Central Asia (IDA & IBRD countries)European UnionFijiFinlandFragile and conflict affected situationsFranceGabonGambia, TheGeorgiaGermanyGhanaGibraltarGreeceGrenadaGuatemalaGuineaGuinea-BissauGuyanaHaitiHeavily indebted poor countries (HIPC)High incomeHondurasHong Kong SAR, ChinaHungaryIBRD onlyIcelandIDA & IBRD totalIDA blendIDA onlyIDA totalIndiaIndonesiaIran, Islamic Rep.IraqIrelandIsraelItalyJamaicaJapanJordanKazakhstanKenyaKiribatiKorea, Dem. People’s Rep.Korea, Rep.KuwaitKyrgyz RepublicLao PDRLate-demographic dividendLatin America & Caribbean Latin America & Caribbean (excluding high income)Latin America & the Caribbean (IDA & IBRD countries)LatviaLeast developed countries: UN classificationLebanonLesothoLiberiaLibyaLiechtensteinLithuaniaLow & middle incomeLow incomeLower middle incomeLuxembourgMacao SAR, ChinaMacedonia, FYRMadagascarMalawiMalaysiaMaldivesMaliMaltaMarshall IslandsMauritaniaMauritiusMexicoMicronesia, Fed. Sts.Middle East & North AfricaMiddle East & North Africa (excluding high income)Middle East & North Africa (IDA & IBRD countries)Middle incomeMoldovaMonacoMongoliaMontenegroMoroccoMozambiqueMyanmarNamibiaNauruNepalNetherlandsNew ZealandNicaraguaNigerNigeriaNorth AmericaNorwayOECD membersOmanOther small statesPacific island small statesPakistanPalauPanamaPapua New GuineaParaguayPeruPhilippinesPolandPortugalPost-demographic dividendPre-demographic dividendPuerto RicoQatarRomaniaRussian FederationRwandaSamoaSan MarinoSao Tome and PrincipeSaudi ArabiaSenegalSerbiaSeychellesSierra LeoneSingaporeSint Maarten (Dutch part)Slovak RepublicSloveniaSmall statesSolomon IslandsSomaliaSouth AfricaSouth AsiaSouth Asia (IDA & IBRD)South SudanSpainSri LankaSt. Kitts and NevisSt. LuciaSt. Vincent and the GrenadinesSub-Saharan Africa Sub-Saharan Africa (excluding high income)Sub-Saharan Africa (IDA & IBRD countries)SudanSurinameSwazilandSwedenSwitzerlandSyrian Arab RepublicTajikistanTanzaniaThailandTimor-LesteTogoTongaTrinidad and TobagoTunisiaTurkeyTurkmenistanTurks and Caicos IslandsTuvaluUgandaUkraineUnited Arab EmiratesUnited KingdomUnited StatesUpper middle incomeUruguayUzbekistanVanuatuVenezuela, RBVietnamWest Bank and GazaWorldYemen, Rep.ZambiaZimbabwe Timeline:
This timeline shows a graph from 1972 to 2015 of Bulgaria. No data until 1971. Number of actual observations by date: 44.
Source name:
World Development Indicators
Source organization:
UNESCO Institute for Statistics
Categories, topics:
Education, Gender
Last updated:
apr 23, 2017
Indicators value changes by year
Minimum:
50.564
jan 1, 2015
Maximum:
52.826
jan 1, 1994
At the date of observation
Value
Absolute change
Change from previous value
jan 1, 1972
51.111
+51.111
0.0%
jan 1, 1973
51.345
+0.235
0.46%
jan 1, 1974
51.363
+0.018
0.03%
jan 1, 1975
51.44
+0.077
0.15%
jan 1, 1976
51.622
+0.181
0.35%
jan 1, 1977
50.932
-0.69
-1.34%
jan 1, 1978
51.83
+0.898
1.76%
jan 1, 1979
51.826
-0.004
-0.01%
jan 1, 1980
51.843
+0.017
0.03%
jan 1, 1981
51.71
-0.133
-0.26%
jan 1, 1982
51.752
+0.042
0.08%
jan 1, 1983
51.676
-0.076
-0.15%
jan 1, 1984
51.605
-0.071
-0.14%
jan 1, 1985
51.844
+0.238
0.46%
jan 1, 1986
51.884
+0.04
0.08%
jan 1, 1987
52.049
+0.165
0.32%
jan 1, 1988
51.936
-0.113
-0.22%
jan 1, 1989
51.978
+0.043
0.08%
jan 1, 1990
51.972
-0.006
-0.01%
jan 1, 1991
52.34
+0.368
0.71%
jan 1, 1992
52.337
-0.004
-0.01%
jan 1, 1993
52.742
+0.405
0.77%
jan 1, 1994
52.826
+0.084
0.16%
jan 1, 1995
52.695
-0.131
-0.25%
jan 1, 1996
52.815
+0.12
0.23%
jan 1, 1997
52.736
-0.079
-0.15%
jan 1, 1998
52.761
+0.025
0.05%
jan 1, 1999
52.481
-0.28
-0.53%
jan 1, 2000
52.353
-0.128
-0.24%
jan 1, 2001
52.093
-0.26
-0.5%
jan 1, 2002
51.776
-0.317
-0.61%
jan 1, 2003
51.559
-0.217
-0.42%
jan 1, 2004
51.746
+0.187
0.36%
jan 1, 2005
51.706
-0.04
-0.08%
jan 1, 2006
51.721
+0.015
0.03%
jan 1, 2007
51.768
+0.047
0.09%
jan 1, 2008
51.77
+0.002
0.0%
jan 1, 2009
51.707
-0.063
-0.12%
jan 1, 2010
51.472
-0.235
-0.45%
jan 1, 2011
51.112
-0.36
-0.7%
jan 1, 2012
51.093
-0.02
-0.04%
jan 1, 2013
50.818
-0.275
-0.54%
jan 1, 2014
50.717
-0.101
-0.2%
jan 1, 2015
50.564
-0.154
-0.3%
Ranking of countries by current statistics by years


Comments: