29
/
en
AIzaSyAYiBZKx7MnpbEhh9jyipgxe19OcubqV5w
April 1, 2024
199617
Mongolia
MNG
true
2
1
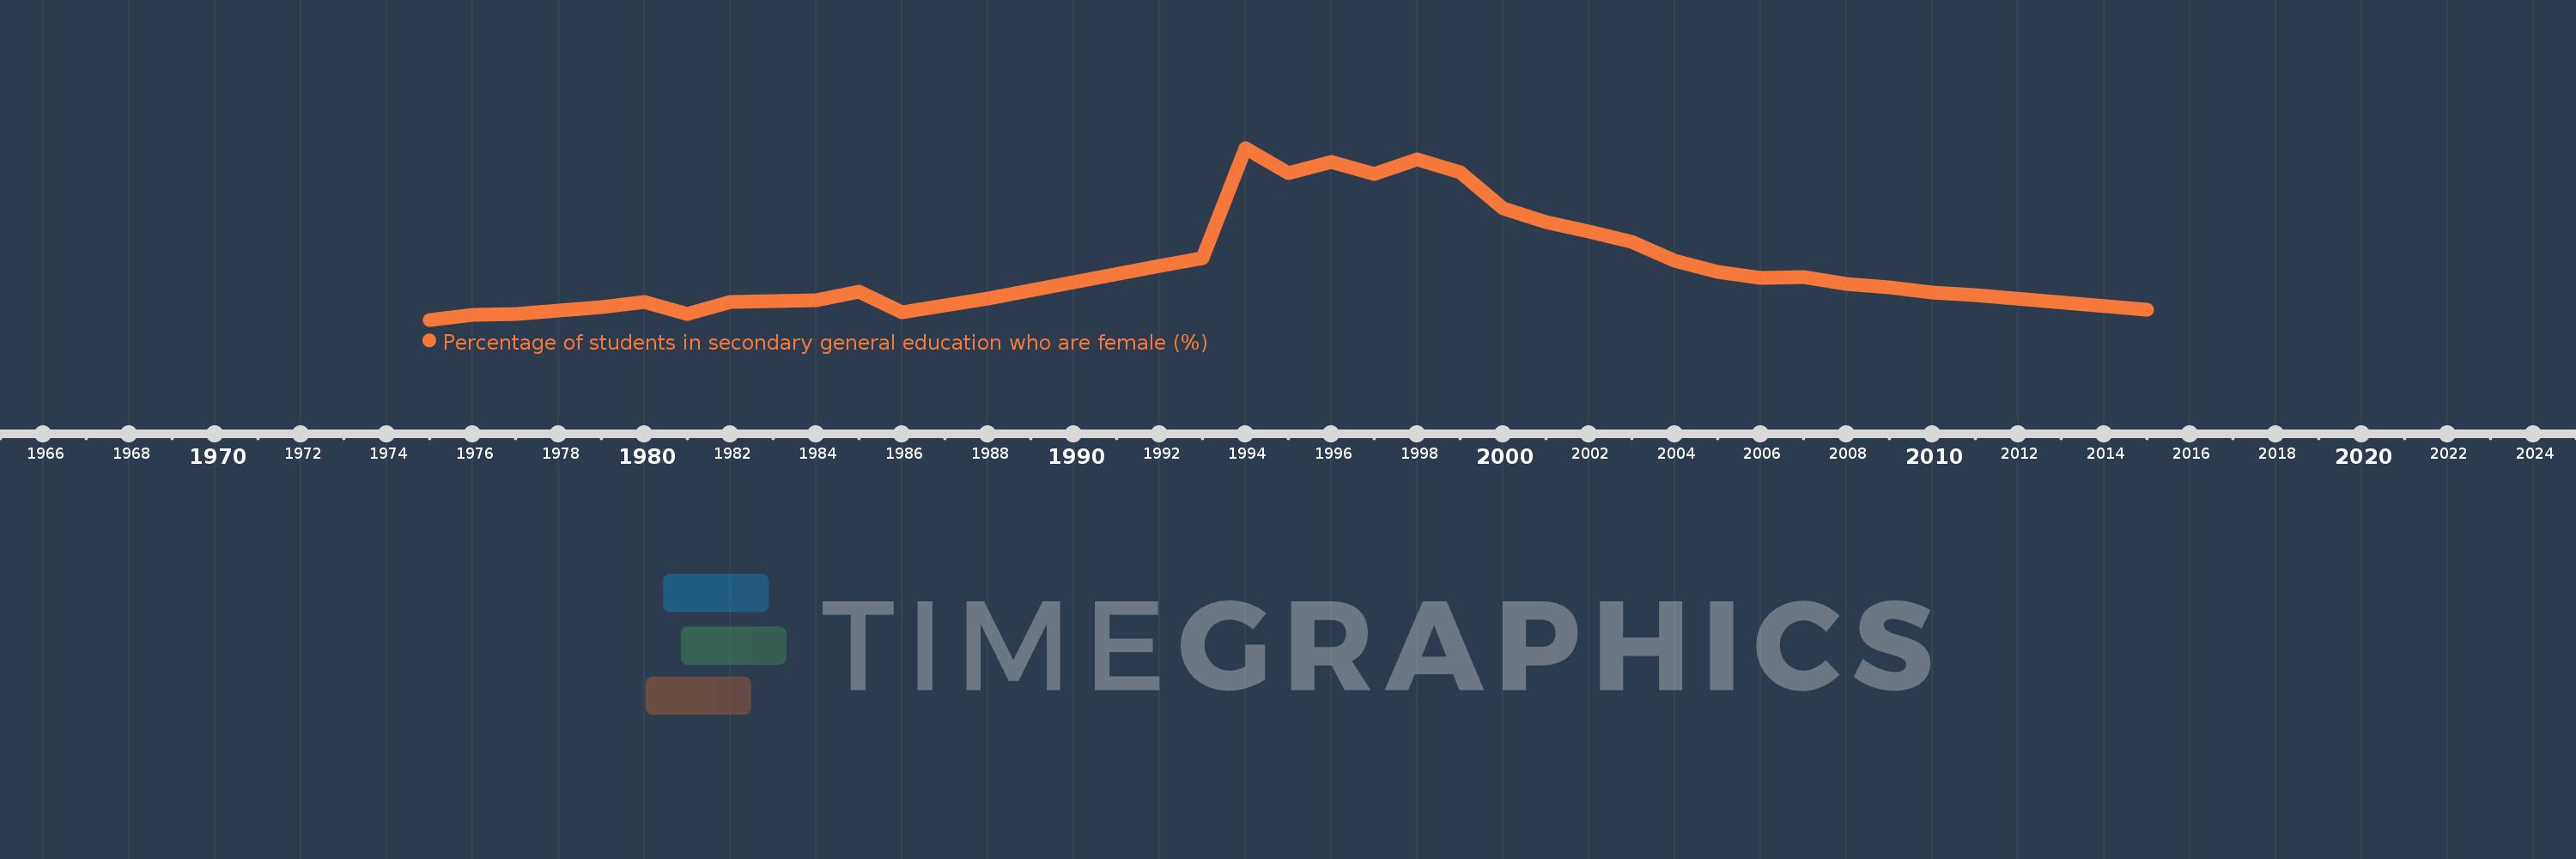
Percentage of students in secondary general education who are female (%)
2015,2011,2010,2009,2008,2007,2006,2005,2004,2003,2002,2001,2000,1999,1998,1997,1996,1995,1994,1993,1992,1988,1986,1985,1984,1983,1982,1981,1980,1979,1977,1976,1975
This statistics in other country:
AfghanistanAlbaniaAlgeriaAndorraAngolaAntigua and BarbudaArab WorldArgentinaArmeniaArubaAustraliaAustriaAzerbaijanBahamas, TheBahrainBangladeshBarbadosBelarusBelgiumBelizeBeninBermudaBhutanBoliviaBosnia and HerzegovinaBotswanaBrazilBritish Virgin IslandsBrunei DarussalamBulgariaBurkina FasoBurundiCabo VerdeCambodiaCameroonCanadaCaribbean small statesCayman IslandsCentral African RepublicCentral Europe and the BalticsChadChileChinaColombiaComorosCongo, Dem. Rep.Congo, Rep.Costa RicaCote d'IvoireCroatiaCubaCuracaoCyprusCzech RepublicDenmarkDjiboutiDominicaDominican RepublicEarly-demographic dividendEast Asia & PacificEast Asia & Pacific (excluding high income)East Asia & Pacific (IDA & IBRD countries)EcuadorEgypt, Arab Rep.El SalvadorEquatorial GuineaEritreaEstoniaEthiopiaEuro areaEurope & Central AsiaEurope & Central Asia (excluding high income)Europe & Central Asia (IDA & IBRD countries)European UnionFijiFinlandFragile and conflict affected situationsFranceGabonGambia, TheGeorgiaGermanyGhanaGibraltarGreeceGrenadaGuatemalaGuineaGuinea-BissauGuyanaHaitiHeavily indebted poor countries (HIPC)High incomeHondurasHong Kong SAR, ChinaHungaryIBRD onlyIcelandIDA & IBRD totalIDA blendIDA onlyIDA totalIndiaIndonesiaIran, Islamic Rep.IraqIrelandIsraelItalyJamaicaJapanJordanKazakhstanKenyaKiribatiKorea, Dem. People’s Rep.Korea, Rep.KuwaitKyrgyz RepublicLao PDRLate-demographic dividendLatin America & Caribbean Latin America & Caribbean (excluding high income)Latin America & the Caribbean (IDA & IBRD countries)LatviaLeast developed countries: UN classificationLebanonLesothoLiberiaLibyaLiechtensteinLithuaniaLow & middle incomeLow incomeLower middle incomeLuxembourgMacao SAR, ChinaMacedonia, FYRMadagascarMalawiMalaysiaMaldivesMaliMaltaMarshall IslandsMauritaniaMauritiusMexicoMicronesia, Fed. Sts.Middle East & North AfricaMiddle East & North Africa (excluding high income)Middle East & North Africa (IDA & IBRD countries)Middle incomeMoldovaMonacoMongoliaMontenegroMoroccoMozambiqueMyanmarNamibiaNauruNepalNetherlandsNew ZealandNicaraguaNigerNigeriaNorth AmericaNorwayOECD membersOmanOther small statesPacific island small statesPakistanPalauPanamaPapua New GuineaParaguayPeruPhilippinesPolandPortugalPost-demographic dividendPre-demographic dividendPuerto RicoQatarRomaniaRussian FederationRwandaSamoaSan MarinoSao Tome and PrincipeSaudi ArabiaSenegalSerbiaSeychellesSierra LeoneSingaporeSint Maarten (Dutch part)Slovak RepublicSloveniaSmall statesSolomon IslandsSomaliaSouth AfricaSouth AsiaSouth Asia (IDA & IBRD)South SudanSpainSri LankaSt. Kitts and NevisSt. LuciaSt. Vincent and the GrenadinesSub-Saharan Africa Sub-Saharan Africa (excluding high income)Sub-Saharan Africa (IDA & IBRD countries)SudanSurinameSwazilandSwedenSwitzerlandSyrian Arab RepublicTajikistanTanzaniaThailandTimor-LesteTogoTongaTrinidad and TobagoTunisiaTurkeyTurkmenistanTurks and Caicos IslandsTuvaluUgandaUkraineUnited Arab EmiratesUnited KingdomUnited StatesUpper middle incomeUruguayUzbekistanVanuatuVenezuela, RBVietnamWest Bank and GazaWorldYemen, Rep.ZambiaZimbabwe Timeline:
This timeline shows a graph from 1975 to 2015 of Mongolia. No data until 1974. Number of actual observations by date: 33.
Source name:
World Development Indicators
Source organization:
UNESCO Institute for Statistics
Categories, topics:
Education, Gender
Last updated:
apr 23, 2017
Indicators value changes by year
Minimum:
50.695
jan 1, 1975
Maximum:
58.147
jan 1, 1994
At the date of observation
Value
Absolute change
Change from previous value
jan 1, 1975
50.695
+50.695
0.0%
jan 1, 1976
50.901
+0.206
0.41%
jan 1, 1977
50.957
+0.056
0.11%
jan 1, 1979
51.253
+0.295
0.58%
jan 1, 1980
51.468
+0.216
0.42%
jan 1, 1981
50.963
-0.506
-0.98%
jan 1, 1982
51.461
+0.498
0.98%
jan 1, 1983
51.506
+0.045
0.09%
jan 1, 1984
51.525
+0.019
0.04%
jan 1, 1985
51.9
+0.375
0.73%
jan 1, 1986
51.012
-0.889
-1.71%
jan 1, 1988
51.599
+0.588
1.15%
jan 1, 1992
53.043
+1.444
2.8%
jan 1, 1993
53.371
+0.328
0.62%
jan 1, 1994
58.147
+4.775
8.95%
jan 1, 1995
57.053
-1.094
-1.88%
jan 1, 1996
57.543
+0.49
0.86%
jan 1, 1997
57.02
-0.523
-0.91%
jan 1, 1998
57.637
+0.617
1.08%
jan 1, 1999
57.102
-0.535
-0.93%
jan 1, 2000
55.529
-1.573
-2.76%
jan 1, 2001
54.919
-0.61
-1.1%
jan 1, 2002
54.534
-0.385
-0.7%
jan 1, 2003
54.066
-0.468
-0.86%
jan 1, 2004
53.266
-0.8
-1.48%
jan 1, 2005
52.76
-0.506
-0.95%
jan 1, 2006
52.518
-0.242
-0.46%
jan 1, 2007
52.56
+0.042
0.08%
jan 1, 2008
52.251
-0.309
-0.59%
jan 1, 2009
52.116
-0.135
-0.26%
jan 1, 2010
51.888
-0.228
-0.44%
jan 1, 2011
51.749
-0.138
-0.27%
jan 1, 2015
51.142
-0.607
-1.17%
Ranking of countries by current statistics by years


Comments: