29
/
en
AIzaSyAYiBZKx7MnpbEhh9jyipgxe19OcubqV5w
April 1, 2024
85366
Bermuda
BMU
true
2
1
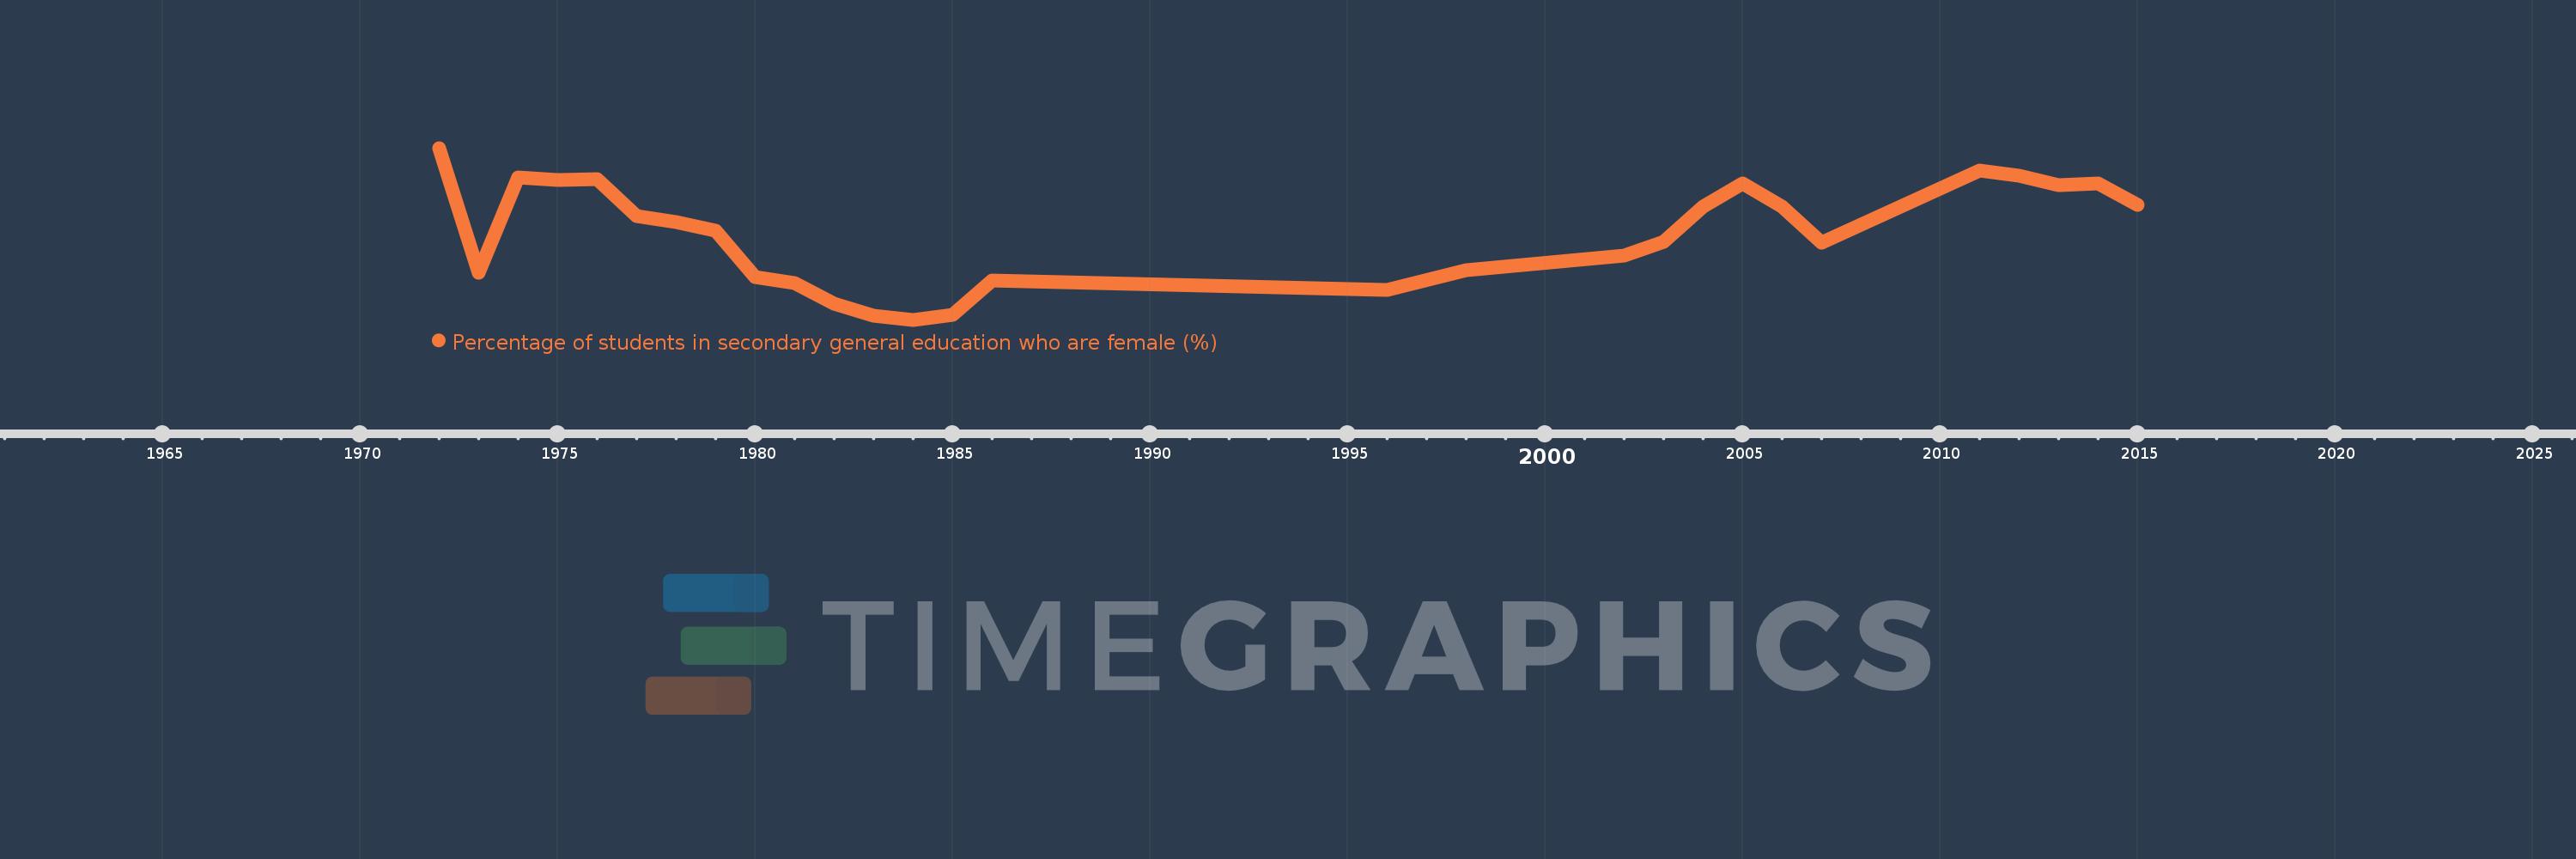
Percentage of students in secondary general education who are female (%)
2015,2014,2013,2012,2011,2007,2006,2005,2004,2003,2002,1998,1996,1986,1985,1984,1983,1982,1981,1980,1979,1978,1977,1976,1975,1974,1973,1972
This statistics in other country:
AfghanistanAlbaniaAlgeriaAndorraAngolaAntigua and BarbudaArab WorldArgentinaArmeniaArubaAustraliaAustriaAzerbaijanBahamas, TheBahrainBangladeshBarbadosBelarusBelgiumBelizeBeninBermudaBhutanBoliviaBosnia and HerzegovinaBotswanaBrazilBritish Virgin IslandsBrunei DarussalamBulgariaBurkina FasoBurundiCabo VerdeCambodiaCameroonCanadaCaribbean small statesCayman IslandsCentral African RepublicCentral Europe and the BalticsChadChileChinaColombiaComorosCongo, Dem. Rep.Congo, Rep.Costa RicaCote d'IvoireCroatiaCubaCuracaoCyprusCzech RepublicDenmarkDjiboutiDominicaDominican RepublicEarly-demographic dividendEast Asia & PacificEast Asia & Pacific (excluding high income)East Asia & Pacific (IDA & IBRD countries)EcuadorEgypt, Arab Rep.El SalvadorEquatorial GuineaEritreaEstoniaEthiopiaEuro areaEurope & Central AsiaEurope & Central Asia (excluding high income)Europe & Central Asia (IDA & IBRD countries)European UnionFijiFinlandFragile and conflict affected situationsFranceGabonGambia, TheGeorgiaGermanyGhanaGibraltarGreeceGrenadaGuatemalaGuineaGuinea-BissauGuyanaHaitiHeavily indebted poor countries (HIPC)High incomeHondurasHong Kong SAR, ChinaHungaryIBRD onlyIcelandIDA & IBRD totalIDA blendIDA onlyIDA totalIndiaIndonesiaIran, Islamic Rep.IraqIrelandIsraelItalyJamaicaJapanJordanKazakhstanKenyaKiribatiKorea, Dem. People’s Rep.Korea, Rep.KuwaitKyrgyz RepublicLao PDRLate-demographic dividendLatin America & Caribbean Latin America & Caribbean (excluding high income)Latin America & the Caribbean (IDA & IBRD countries)LatviaLeast developed countries: UN classificationLebanonLesothoLiberiaLibyaLiechtensteinLithuaniaLow & middle incomeLow incomeLower middle incomeLuxembourgMacao SAR, ChinaMacedonia, FYRMadagascarMalawiMalaysiaMaldivesMaliMaltaMarshall IslandsMauritaniaMauritiusMexicoMicronesia, Fed. Sts.Middle East & North AfricaMiddle East & North Africa (excluding high income)Middle East & North Africa (IDA & IBRD countries)Middle incomeMoldovaMonacoMongoliaMontenegroMoroccoMozambiqueMyanmarNamibiaNauruNepalNetherlandsNew ZealandNicaraguaNigerNigeriaNorth AmericaNorwayOECD membersOmanOther small statesPacific island small statesPakistanPalauPanamaPapua New GuineaParaguayPeruPhilippinesPolandPortugalPost-demographic dividendPre-demographic dividendPuerto RicoQatarRomaniaRussian FederationRwandaSamoaSan MarinoSao Tome and PrincipeSaudi ArabiaSenegalSerbiaSeychellesSierra LeoneSingaporeSint Maarten (Dutch part)Slovak RepublicSloveniaSmall statesSolomon IslandsSomaliaSouth AfricaSouth AsiaSouth Asia (IDA & IBRD)South SudanSpainSri LankaSt. Kitts and NevisSt. LuciaSt. Vincent and the GrenadinesSub-Saharan Africa Sub-Saharan Africa (excluding high income)Sub-Saharan Africa (IDA & IBRD countries)SudanSurinameSwazilandSwedenSwitzerlandSyrian Arab RepublicTajikistanTanzaniaThailandTimor-LesteTogoTongaTrinidad and TobagoTunisiaTurkeyTurkmenistanTurks and Caicos IslandsTuvaluUgandaUkraineUnited Arab EmiratesUnited KingdomUnited StatesUpper middle incomeUruguayUzbekistanVanuatuVenezuela, RBVietnamWest Bank and GazaWorldYemen, Rep.ZambiaZimbabwe Timeline:
This timeline shows a graph from 1972 to 2015 of Bermuda. No data until 1971. Number of actual observations by date: 28.
Source name:
World Development Indicators
Source organization:
UNESCO Institute for Statistics
Categories, topics:
Education, Gender
Last updated:
apr 23, 2017
Indicators value changes by year
Minimum:
49.378
jan 1, 1984
Maximum:
54.032
jan 1, 1972
At the date of observation
Value
Absolute change
Change from previous value
jan 1, 1972
54.032
+54.032
0.0%
jan 1, 1973
50.645
-3.388
-6.27%
jan 1, 1974
53.233
+2.588
5.11%
jan 1, 1975
53.161
-0.071
-0.13%
jan 1, 1976
53.191
+0.03
0.06%
jan 1, 1977
52.177
-1.015
-1.91%
jan 1, 1978
52.03
-0.146
-0.28%
jan 1, 1979
51.794
-0.237
-0.46%
jan 1, 1980
50.542
-1.252
-2.42%
jan 1, 1981
50.363
-0.179
-0.35%
jan 1, 1982
49.804
-0.559
-1.11%
jan 1, 1983
49.49
-0.315
-0.63%
jan 1, 1984
49.378
-0.112
-0.23%
jan 1, 1985
49.515
+0.137
0.28%
jan 1, 1986
50.432
+0.917
1.85%
jan 1, 1996
50.183
-0.249
-0.49%
jan 1, 1998
50.725
+0.542
1.08%
jan 1, 2002
51.117
+0.392
0.77%
jan 1, 2003
51.479
+0.362
0.71%
jan 1, 2004
52.446
+0.968
1.88%
jan 1, 2005
53.071
+0.625
1.19%
jan 1, 2006
52.439
-0.632
-1.19%
jan 1, 2007
51.461
-0.978
-1.87%
jan 1, 2011
53.418
+1.957
3.8%
jan 1, 2012
53.287
-0.131
-0.24%
jan 1, 2013
53.03
-0.257
-0.48%
jan 1, 2014
53.078
+0.048
0.09%
jan 1, 2015
52.48
-0.598
-1.13%
Ranking of countries by current statistics by years


Comments: