29
/
en
AIzaSyAYiBZKx7MnpbEhh9jyipgxe19OcubqV5w
April 1, 2024
117303
Cyprus
CYP
true
2
1
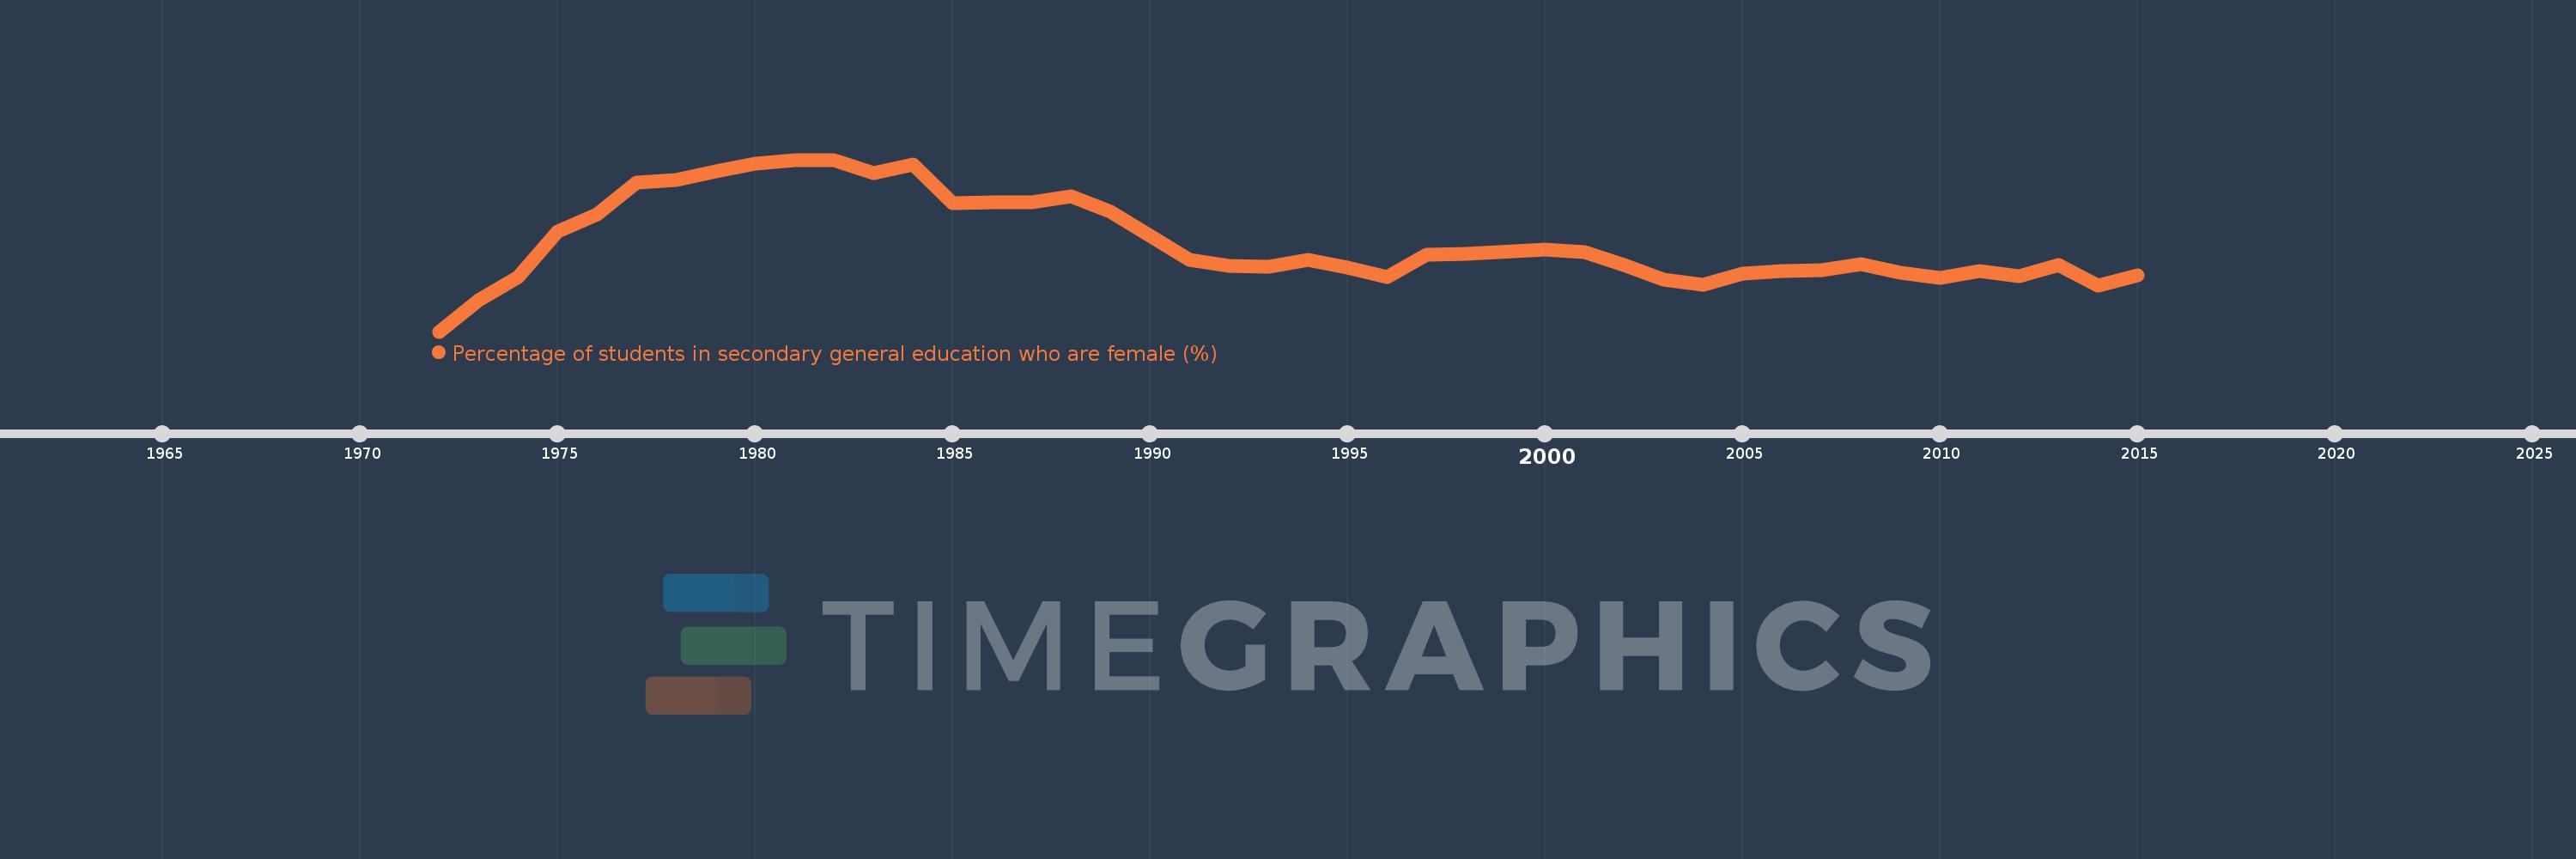
Percentage of students in secondary general education who are female (%)
2015,2014,2013,2012,2011,2010,2009,2008,2007,2006,2005,2004,2003,2002,2001,2000,1998,1997,1996,1995,1994,1993,1992,1991,1990,1989,1988,1987,1986,1985,1984,1983,1982,1981,1980,1979,1978,1977,1976,1975,1974,1973,1972
This statistics in other country:
AfghanistanAlbaniaAlgeriaAndorraAngolaAntigua and BarbudaArab WorldArgentinaArmeniaArubaAustraliaAustriaAzerbaijanBahamas, TheBahrainBangladeshBarbadosBelarusBelgiumBelizeBeninBermudaBhutanBoliviaBosnia and HerzegovinaBotswanaBrazilBritish Virgin IslandsBrunei DarussalamBulgariaBurkina FasoBurundiCabo VerdeCambodiaCameroonCanadaCaribbean small statesCayman IslandsCentral African RepublicCentral Europe and the BalticsChadChileChinaColombiaComorosCongo, Dem. Rep.Congo, Rep.Costa RicaCote d'IvoireCroatiaCubaCuracaoCyprusCzech RepublicDenmarkDjiboutiDominicaDominican RepublicEarly-demographic dividendEast Asia & PacificEast Asia & Pacific (excluding high income)East Asia & Pacific (IDA & IBRD countries)EcuadorEgypt, Arab Rep.El SalvadorEquatorial GuineaEritreaEstoniaEthiopiaEuro areaEurope & Central AsiaEurope & Central Asia (excluding high income)Europe & Central Asia (IDA & IBRD countries)European UnionFijiFinlandFragile and conflict affected situationsFranceGabonGambia, TheGeorgiaGermanyGhanaGibraltarGreeceGrenadaGuatemalaGuineaGuinea-BissauGuyanaHaitiHeavily indebted poor countries (HIPC)High incomeHondurasHong Kong SAR, ChinaHungaryIBRD onlyIcelandIDA & IBRD totalIDA blendIDA onlyIDA totalIndiaIndonesiaIran, Islamic Rep.IraqIrelandIsraelItalyJamaicaJapanJordanKazakhstanKenyaKiribatiKorea, Dem. People’s Rep.Korea, Rep.KuwaitKyrgyz RepublicLao PDRLate-demographic dividendLatin America & Caribbean Latin America & Caribbean (excluding high income)Latin America & the Caribbean (IDA & IBRD countries)LatviaLeast developed countries: UN classificationLebanonLesothoLiberiaLibyaLiechtensteinLithuaniaLow & middle incomeLow incomeLower middle incomeLuxembourgMacao SAR, ChinaMacedonia, FYRMadagascarMalawiMalaysiaMaldivesMaliMaltaMarshall IslandsMauritaniaMauritiusMexicoMicronesia, Fed. Sts.Middle East & North AfricaMiddle East & North Africa (excluding high income)Middle East & North Africa (IDA & IBRD countries)Middle incomeMoldovaMonacoMongoliaMontenegroMoroccoMozambiqueMyanmarNamibiaNauruNepalNetherlandsNew ZealandNicaraguaNigerNigeriaNorth AmericaNorwayOECD membersOmanOther small statesPacific island small statesPakistanPalauPanamaPapua New GuineaParaguayPeruPhilippinesPolandPortugalPost-demographic dividendPre-demographic dividendPuerto RicoQatarRomaniaRussian FederationRwandaSamoaSan MarinoSao Tome and PrincipeSaudi ArabiaSenegalSerbiaSeychellesSierra LeoneSingaporeSint Maarten (Dutch part)Slovak RepublicSloveniaSmall statesSolomon IslandsSomaliaSouth AfricaSouth AsiaSouth Asia (IDA & IBRD)South SudanSpainSri LankaSt. Kitts and NevisSt. LuciaSt. Vincent and the GrenadinesSub-Saharan Africa Sub-Saharan Africa (excluding high income)Sub-Saharan Africa (IDA & IBRD countries)SudanSurinameSwazilandSwedenSwitzerlandSyrian Arab RepublicTajikistanTanzaniaThailandTimor-LesteTogoTongaTrinidad and TobagoTunisiaTurkeyTurkmenistanTurks and Caicos IslandsTuvaluUgandaUkraineUnited Arab EmiratesUnited KingdomUnited StatesUpper middle incomeUruguayUzbekistanVanuatuVenezuela, RBVietnamWest Bank and GazaWorldYemen, Rep.ZambiaZimbabwe Timeline:
This timeline shows a graph from 1972 to 2015 of Cyprus. No data until 1971. Number of actual observations by date: 43.
Source name:
World Development Indicators
Source organization:
UNESCO Institute for Statistics
Categories, topics:
Education, Gender
Last updated:
apr 23, 2017
Indicators value changes by year
Minimum:
50.243
jan 1, 1972
Maximum:
53.747
jan 1, 1982
At the date of observation
Value
Absolute change
Change from previous value
jan 1, 1972
50.243
+50.243
0.0%
jan 1, 1973
50.874
+0.631
1.26%
jan 1, 1974
51.351
+0.477
0.94%
jan 1, 1975
52.287
+0.936
1.82%
jan 1, 1976
52.635
+0.349
0.67%
jan 1, 1977
53.279
+0.644
1.22%
jan 1, 1978
53.335
+0.056
0.11%
jan 1, 1979
53.517
+0.182
0.34%
jan 1, 1980
53.667
+0.15
0.28%
jan 1, 1981
53.74
+0.072
0.13%
jan 1, 1982
53.747
+0.007
0.01%
jan 1, 1983
53.468
-0.279
-0.52%
jan 1, 1984
53.642
+0.174
0.32%
jan 1, 1985
52.861
-0.781
-1.46%
jan 1, 1986
52.872
+0.011
0.02%
jan 1, 1987
52.884
+0.012
0.02%
jan 1, 1988
53.004
+0.12
0.23%
jan 1, 1989
52.693
-0.311
-0.59%
jan 1, 1990
52.202
-0.491
-0.93%
jan 1, 1991
51.713
-0.489
-0.94%
jan 1, 1992
51.58
-0.133
-0.26%
jan 1, 1993
51.574
-0.006
-0.01%
jan 1, 1994
51.699
+0.125
0.24%
jan 1, 1995
51.555
-0.144
-0.28%
jan 1, 1996
51.357
-0.198
-0.38%
jan 1, 1997
51.814
+0.457
0.89%
jan 1, 1998
51.822
+0.008
0.02%
jan 1, 2000
51.914
+0.093
0.18%
jan 1, 2001
51.87
-0.045
-0.09%
jan 1, 2002
51.595
-0.275
-0.53%
jan 1, 2003
51.303
-0.292
-0.57%
jan 1, 2004
51.198
-0.105
-0.21%
jan 1, 2005
51.419
+0.22
0.43%
jan 1, 2006
51.471
+0.053
0.1%
jan 1, 2007
51.491
+0.02
0.04%
jan 1, 2008
51.625
+0.133
0.26%
jan 1, 2009
51.445
-0.18
-0.35%
jan 1, 2010
51.344
-0.101
-0.2%
jan 1, 2011
51.477
+0.133
0.26%
jan 1, 2012
51.378
-0.1
-0.19%
jan 1, 2013
51.596
+0.219
0.43%
jan 1, 2014
51.176
-0.421
-0.82%
jan 1, 2015
51.382
+0.206
0.4%
Ranking of countries by current statistics by years


Comments: