29
/
en
AIzaSyAYiBZKx7MnpbEhh9jyipgxe19OcubqV5w
April 1, 2024
56530
Small states
SST
false
2
1
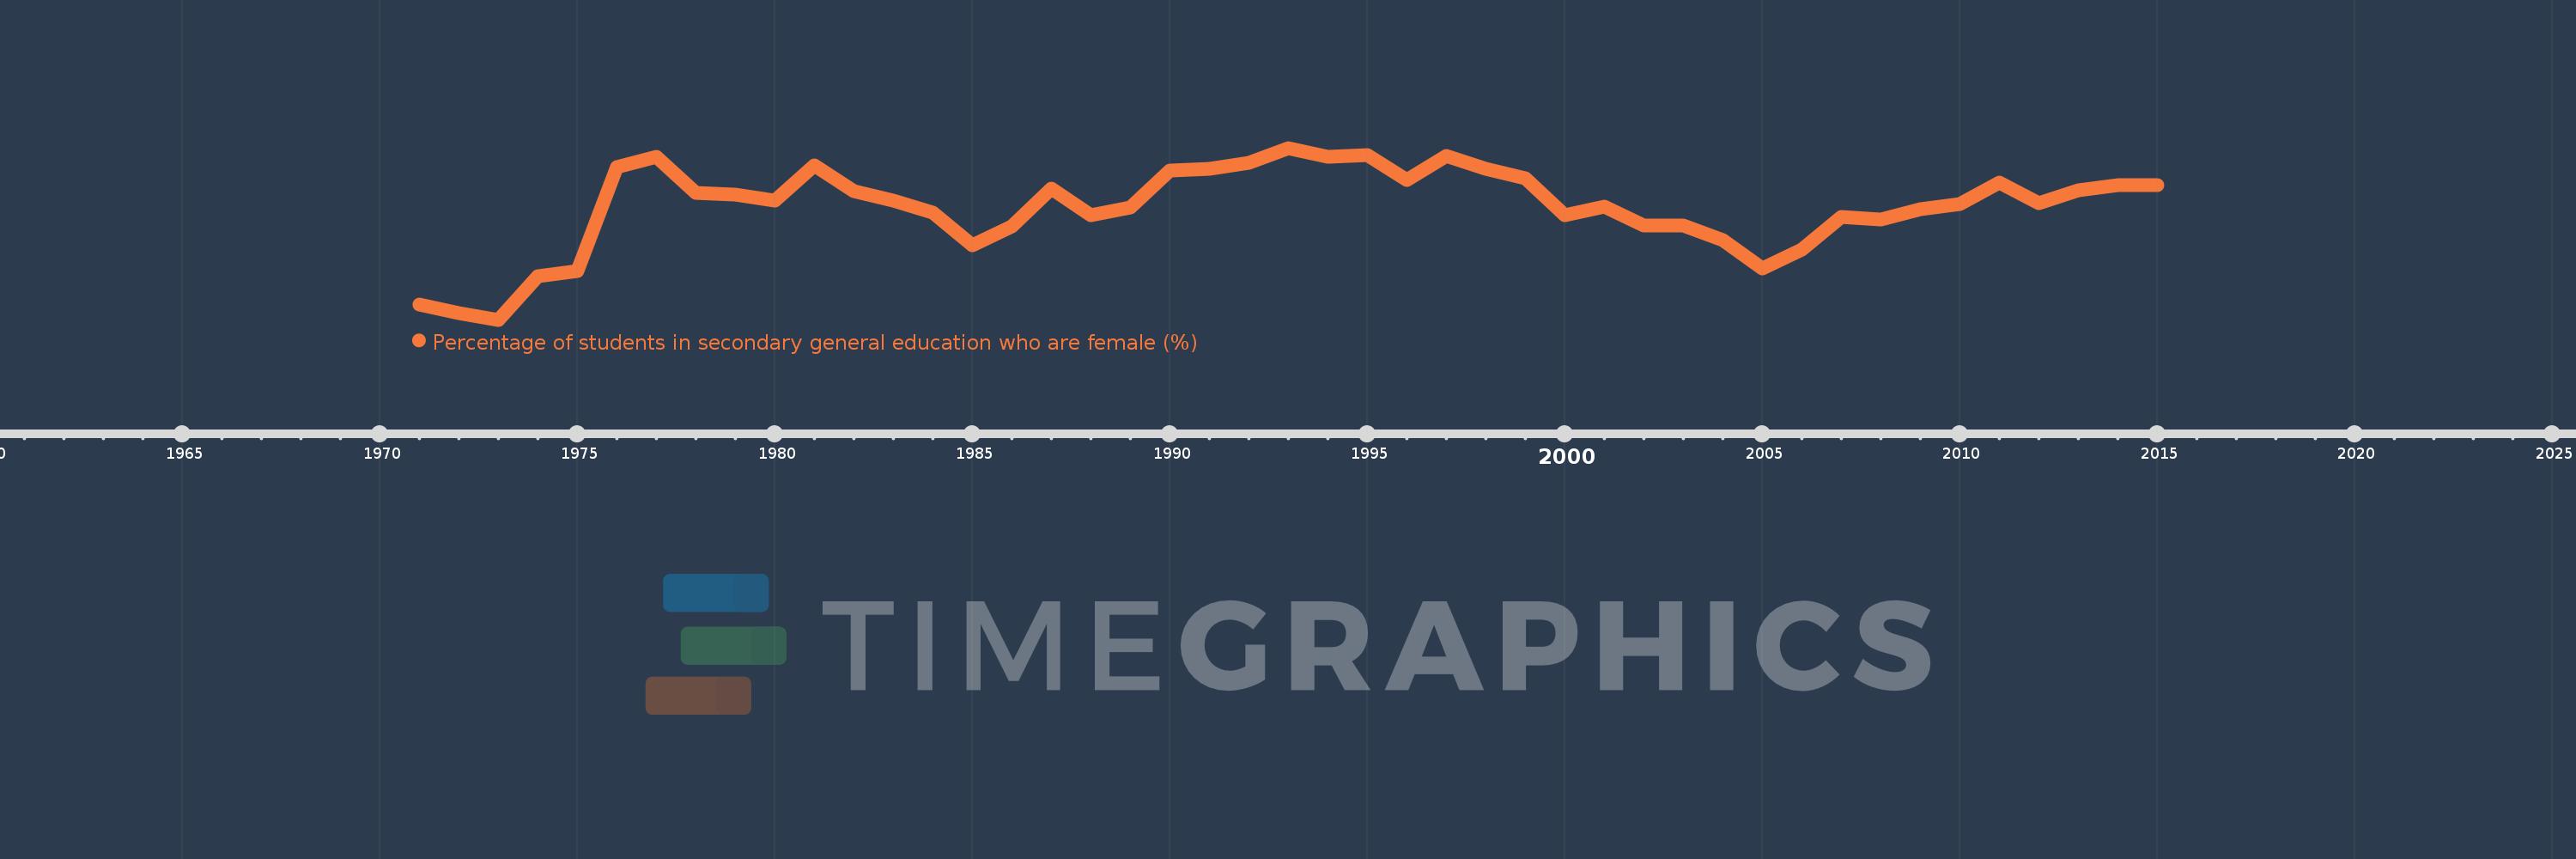
Percentage of students in secondary general education who are female (%)
2015,2014,2013,2012,2011,2010,2009,2008,2007,2006,2005,2004,2003,2002,2001,2000,1999,1998,1997,1996,1995,1994,1993,1992,1991,1990,1989,1988,1987,1986,1985,1984,1983,1982,1981,1980,1979,1978,1977,1976,1975,1974,1973,1972,1971
This statistics in other country:
AfghanistanAlbaniaAlgeriaAndorraAngolaAntigua and BarbudaArab WorldArgentinaArmeniaArubaAustraliaAustriaAzerbaijanBahamas, TheBahrainBangladeshBarbadosBelarusBelgiumBelizeBeninBermudaBhutanBoliviaBosnia and HerzegovinaBotswanaBrazilBritish Virgin IslandsBrunei DarussalamBulgariaBurkina FasoBurundiCabo VerdeCambodiaCameroonCanadaCaribbean small statesCayman IslandsCentral African RepublicCentral Europe and the BalticsChadChileChinaColombiaComorosCongo, Dem. Rep.Congo, Rep.Costa RicaCote d'IvoireCroatiaCubaCuracaoCyprusCzech RepublicDenmarkDjiboutiDominicaDominican RepublicEarly-demographic dividendEast Asia & PacificEast Asia & Pacific (excluding high income)East Asia & Pacific (IDA & IBRD countries)EcuadorEgypt, Arab Rep.El SalvadorEquatorial GuineaEritreaEstoniaEthiopiaEuro areaEurope & Central AsiaEurope & Central Asia (excluding high income)Europe & Central Asia (IDA & IBRD countries)European UnionFijiFinlandFragile and conflict affected situationsFranceGabonGambia, TheGeorgiaGermanyGhanaGibraltarGreeceGrenadaGuatemalaGuineaGuinea-BissauGuyanaHaitiHeavily indebted poor countries (HIPC)High incomeHondurasHong Kong SAR, ChinaHungaryIBRD onlyIcelandIDA & IBRD totalIDA blendIDA onlyIDA totalIndiaIndonesiaIran, Islamic Rep.IraqIrelandIsraelItalyJamaicaJapanJordanKazakhstanKenyaKiribatiKorea, Dem. People’s Rep.Korea, Rep.KuwaitKyrgyz RepublicLao PDRLate-demographic dividendLatin America & Caribbean Latin America & Caribbean (excluding high income)Latin America & the Caribbean (IDA & IBRD countries)LatviaLeast developed countries: UN classificationLebanonLesothoLiberiaLibyaLiechtensteinLithuaniaLow & middle incomeLow incomeLower middle incomeLuxembourgMacao SAR, ChinaMacedonia, FYRMadagascarMalawiMalaysiaMaldivesMaliMaltaMarshall IslandsMauritaniaMauritiusMexicoMicronesia, Fed. Sts.Middle East & North AfricaMiddle East & North Africa (excluding high income)Middle East & North Africa (IDA & IBRD countries)Middle incomeMoldovaMonacoMongoliaMontenegroMoroccoMozambiqueMyanmarNamibiaNauruNepalNetherlandsNew ZealandNicaraguaNigerNigeriaNorth AmericaNorwayOECD membersOmanOther small statesPacific island small statesPakistanPalauPanamaPapua New GuineaParaguayPeruPhilippinesPolandPortugalPost-demographic dividendPre-demographic dividendPuerto RicoQatarRomaniaRussian FederationRwandaSamoaSan MarinoSao Tome and PrincipeSaudi ArabiaSenegalSerbiaSeychellesSierra LeoneSingaporeSint Maarten (Dutch part)Slovak RepublicSloveniaSmall statesSolomon IslandsSomaliaSouth AfricaSouth AsiaSouth Asia (IDA & IBRD)South SudanSpainSri LankaSt. Kitts and NevisSt. LuciaSt. Vincent and the GrenadinesSub-Saharan Africa Sub-Saharan Africa (excluding high income)Sub-Saharan Africa (IDA & IBRD countries)SudanSurinameSwazilandSwedenSwitzerlandSyrian Arab RepublicTajikistanTanzaniaThailandTimor-LesteTogoTongaTrinidad and TobagoTunisiaTurkeyTurkmenistanTurks and Caicos IslandsTuvaluUgandaUkraineUnited Arab EmiratesUnited KingdomUnited StatesUpper middle incomeUruguayUzbekistanVanuatuVenezuela, RBVietnamWest Bank and GazaWorldYemen, Rep.ZambiaZimbabwe Timeline:
This timeline shows a graph from 1971 to 2015 of Small states. No data until 1970. Number of actual observations by date: 45.
Source name:
World Development Indicators
Source organization:
UNESCO Institute for Statistics
Categories, topics:
Education, Gender
Last updated:
apr 23, 2017
Indicators value changes by year
Minimum:
49.792
jan 1, 1973
Maximum:
50.845
jan 1, 1993
At the date of observation
Value
Absolute change
Change from previous value
jan 1, 1971
49.883
+49.883
0.0%
jan 1, 1972
49.83
-0.053
-0.11%
jan 1, 1973
49.792
-0.039
-0.08%
jan 1, 1974
50.057
+0.265
0.53%
jan 1, 1975
50.092
+0.035
0.07%
jan 1, 1976
50.725
+0.633
1.26%
jan 1, 1977
50.791
+0.066
0.13%
jan 1, 1978
50.568
-0.223
-0.44%
jan 1, 1979
50.557
-0.01
-0.02%
jan 1, 1980
50.52
-0.038
-0.07%
jan 1, 1981
50.736
+0.216
0.43%
jan 1, 1982
50.579
-0.157
-0.31%
jan 1, 1983
50.524
-0.055
-0.11%
jan 1, 1984
50.45
-0.073
-0.15%
jan 1, 1985
50.249
-0.201
-0.4%
jan 1, 1986
50.364
+0.115
0.23%
jan 1, 1987
50.595
+0.231
0.46%
jan 1, 1988
50.434
-0.161
-0.32%
jan 1, 1989
50.481
+0.047
0.09%
jan 1, 1990
50.706
+0.224
0.44%
jan 1, 1991
50.718
+0.012
0.02%
jan 1, 1992
50.752
+0.034
0.07%
jan 1, 1993
50.845
+0.093
0.18%
jan 1, 1994
50.793
-0.052
-0.1%
jan 1, 1995
50.803
+0.01
0.02%
jan 1, 1996
50.649
-0.154
-0.3%
jan 1, 1997
50.795
+0.146
0.29%
jan 1, 1998
50.715
-0.08
-0.16%
jan 1, 1999
50.66
-0.055
-0.11%
jan 1, 2000
50.431
-0.229
-0.45%
jan 1, 2001
50.484
+0.053
0.1%
jan 1, 2002
50.369
-0.115
-0.23%
jan 1, 2003
50.372
+0.002
0.0%
jan 1, 2004
50.28
-0.091
-0.18%
jan 1, 2005
50.108
-0.172
-0.34%
jan 1, 2006
50.224
+0.117
0.23%
jan 1, 2007
50.423
+0.198
0.4%
jan 1, 2008
50.406
-0.017
-0.03%
jan 1, 2009
50.469
+0.063
0.12%
jan 1, 2010
50.503
+0.034
0.07%
jan 1, 2011
50.632
+0.13
0.26%
jan 1, 2012
50.509
-0.124
-0.24%
jan 1, 2013
50.585
+0.076
0.15%
jan 1, 2014
50.619
+0.034
0.07%
jan 1, 2015
50.617
-0.001
0.0%
Ranking of countries by current statistics by years


Comments: