29
/
en
AIzaSyAYiBZKx7MnpbEhh9jyipgxe19OcubqV5w
April 1, 2024
63917
Afghanistan
AFG
true
2
1
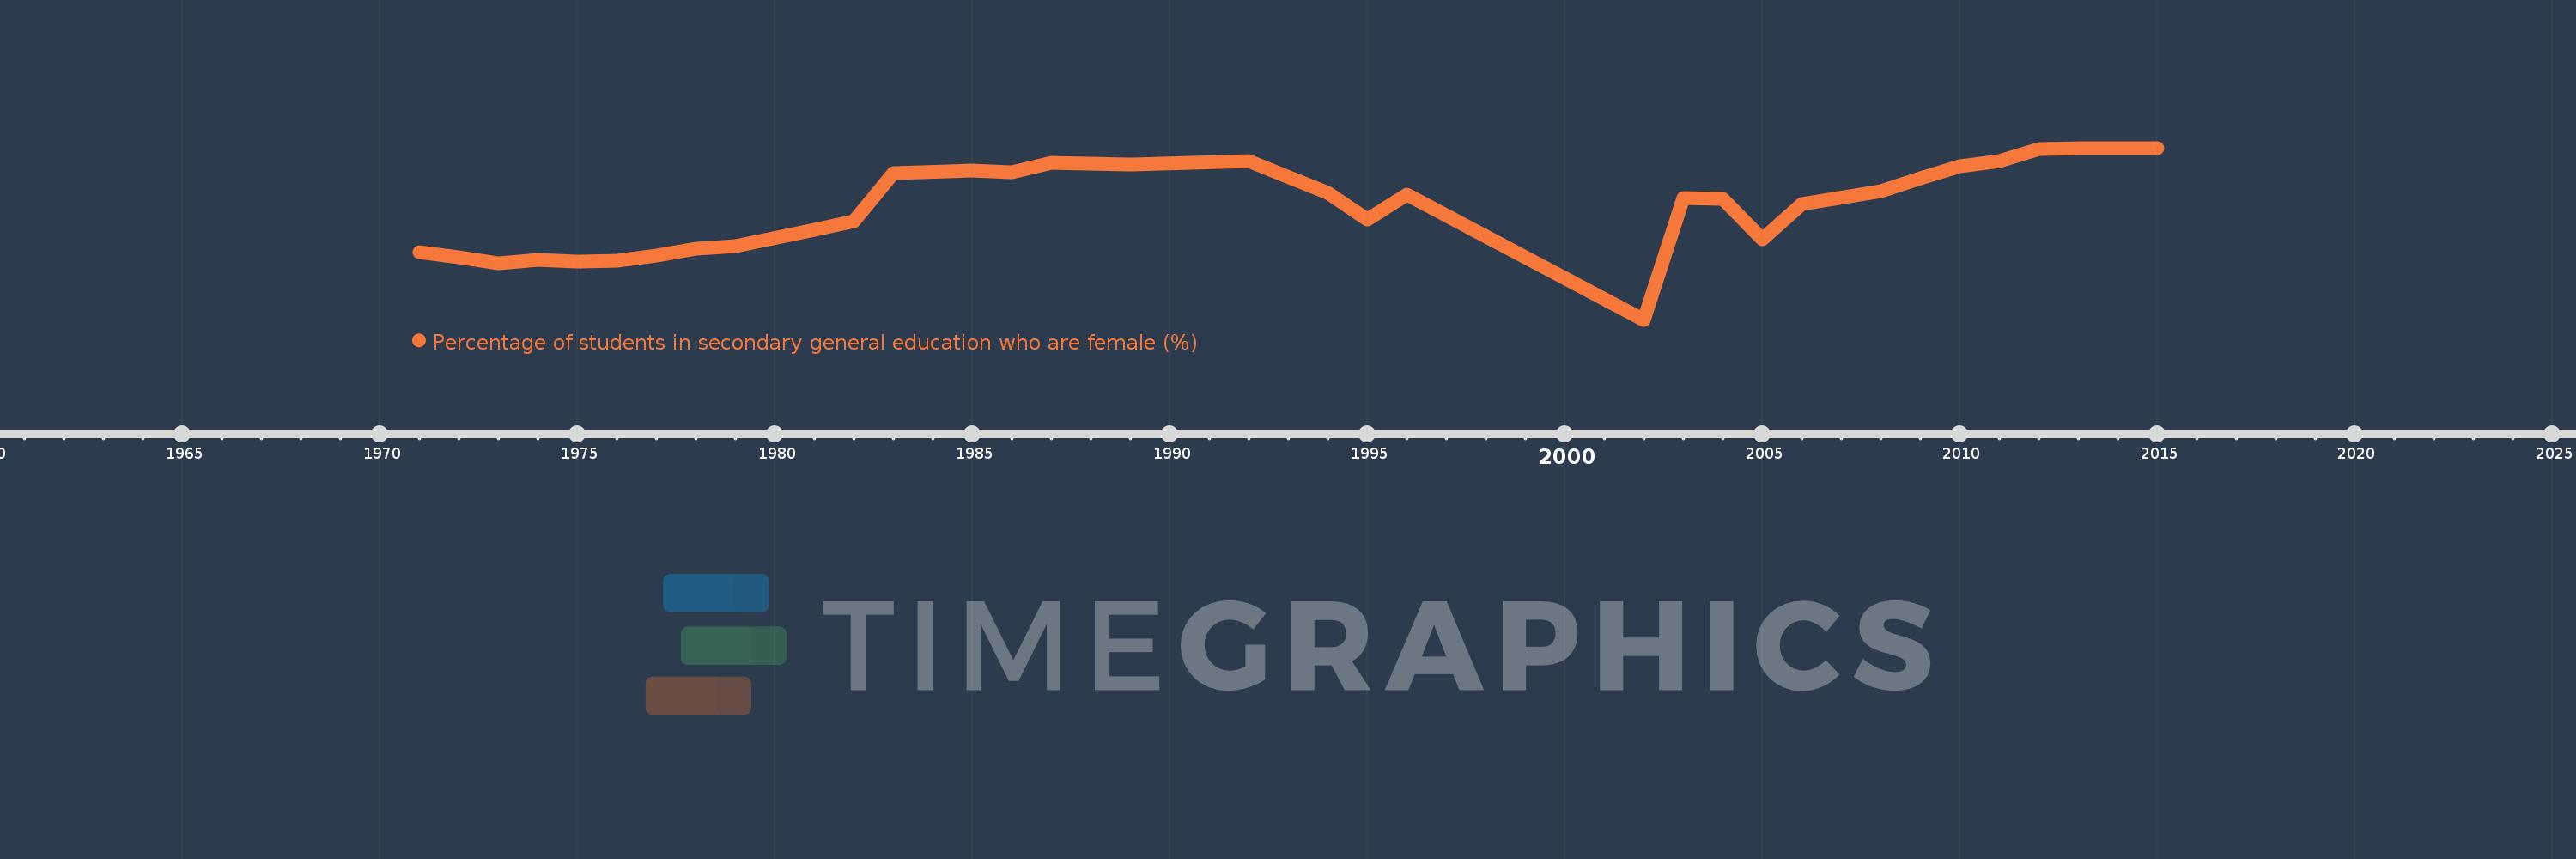
Percentage of students in secondary general education who are female (%)
2015,2014,2013,2012,2011,2010,2009,2008,2006,2005,2004,2003,2002,1996,1995,1994,1992,1989,1987,1986,1985,1983,1982,1981,1979,1978,1977,1976,1975,1974,1973,1972,1971
This statistics in other country:
AfghanistanAlbaniaAlgeriaAndorraAngolaAntigua and BarbudaArab WorldArgentinaArmeniaArubaAustraliaAustriaAzerbaijanBahamas, TheBahrainBangladeshBarbadosBelarusBelgiumBelizeBeninBermudaBhutanBoliviaBosnia and HerzegovinaBotswanaBrazilBritish Virgin IslandsBrunei DarussalamBulgariaBurkina FasoBurundiCabo VerdeCambodiaCameroonCanadaCaribbean small statesCayman IslandsCentral African RepublicCentral Europe and the BalticsChadChileChinaColombiaComorosCongo, Dem. Rep.Congo, Rep.Costa RicaCote d'IvoireCroatiaCubaCuracaoCyprusCzech RepublicDenmarkDjiboutiDominicaDominican RepublicEarly-demographic dividendEast Asia & PacificEast Asia & Pacific (excluding high income)East Asia & Pacific (IDA & IBRD countries)EcuadorEgypt, Arab Rep.El SalvadorEquatorial GuineaEritreaEstoniaEthiopiaEuro areaEurope & Central AsiaEurope & Central Asia (excluding high income)Europe & Central Asia (IDA & IBRD countries)European UnionFijiFinlandFragile and conflict affected situationsFranceGabonGambia, TheGeorgiaGermanyGhanaGibraltarGreeceGrenadaGuatemalaGuineaGuinea-BissauGuyanaHaitiHeavily indebted poor countries (HIPC)High incomeHondurasHong Kong SAR, ChinaHungaryIBRD onlyIcelandIDA & IBRD totalIDA blendIDA onlyIDA totalIndiaIndonesiaIran, Islamic Rep.IraqIrelandIsraelItalyJamaicaJapanJordanKazakhstanKenyaKiribatiKorea, Dem. People’s Rep.Korea, Rep.KuwaitKyrgyz RepublicLao PDRLate-demographic dividendLatin America & Caribbean Latin America & Caribbean (excluding high income)Latin America & the Caribbean (IDA & IBRD countries)LatviaLeast developed countries: UN classificationLebanonLesothoLiberiaLibyaLiechtensteinLithuaniaLow & middle incomeLow incomeLower middle incomeLuxembourgMacao SAR, ChinaMacedonia, FYRMadagascarMalawiMalaysiaMaldivesMaliMaltaMarshall IslandsMauritaniaMauritiusMexicoMicronesia, Fed. Sts.Middle East & North AfricaMiddle East & North Africa (excluding high income)Middle East & North Africa (IDA & IBRD countries)Middle incomeMoldovaMonacoMongoliaMontenegroMoroccoMozambiqueMyanmarNamibiaNauruNepalNetherlandsNew ZealandNicaraguaNigerNigeriaNorth AmericaNorwayOECD membersOmanOther small statesPacific island small statesPakistanPalauPanamaPapua New GuineaParaguayPeruPhilippinesPolandPortugalPost-demographic dividendPre-demographic dividendPuerto RicoQatarRomaniaRussian FederationRwandaSamoaSan MarinoSao Tome and PrincipeSaudi ArabiaSenegalSerbiaSeychellesSierra LeoneSingaporeSint Maarten (Dutch part)Slovak RepublicSloveniaSmall statesSolomon IslandsSomaliaSouth AfricaSouth AsiaSouth Asia (IDA & IBRD)South SudanSpainSri LankaSt. Kitts and NevisSt. LuciaSt. Vincent and the GrenadinesSub-Saharan Africa Sub-Saharan Africa (excluding high income)Sub-Saharan Africa (IDA & IBRD countries)SudanSurinameSwazilandSwedenSwitzerlandSyrian Arab RepublicTajikistanTanzaniaThailandTimor-LesteTogoTongaTrinidad and TobagoTunisiaTurkeyTurkmenistanTurks and Caicos IslandsTuvaluUgandaUkraineUnited Arab EmiratesUnited KingdomUnited StatesUpper middle incomeUruguayUzbekistanVanuatuVenezuela, RBVietnamWest Bank and GazaWorldYemen, Rep.ZambiaZimbabwe Timeline:
This timeline shows a graph from 1971 to 2015 of Afghanistan. No data until 1970. Number of actual observations by date: 33.
Source name:
World Development Indicators
Source organization:
UNESCO Institute for Statistics
Categories, topics:
Education, Gender
Last updated:
apr 23, 2017
Indicators value changes by year
Maximum:
34.883
jan 1, 2015
At the date of observation
Value
Absolute change
Change from previous value
jan 1, 1971
13.694
+13.694
0.0%
jan 1, 1972
12.622
-1.072
-7.82%
jan 1, 1973
11.441
-1.181
-9.36%
jan 1, 1974
12.134
+0.693
6.06%
jan 1, 1975
11.825
-0.309
-2.55%
jan 1, 1976
12.033
+0.207
1.75%
jan 1, 1977
12.98
+0.948
7.88%
jan 1, 1978
14.414
+1.433
11.04%
jan 1, 1979
14.95
+0.536
3.72%
jan 1, 1981
18.285
+3.335
22.31%
jan 1, 1982
20.092
+1.807
9.88%
jan 1, 1983
29.813
+9.721
48.38%
jan 1, 1985
30.274
+0.461
1.55%
jan 1, 1986
29.961
-0.314
-1.04%
jan 1, 1987
31.875
+1.914
6.39%
jan 1, 1989
31.553
-0.322
-1.01%
jan 1, 1992
32.158
+0.605
1.92%
jan 1, 1994
25.798
-6.361
-19.78%
jan 1, 1995
20.347
-5.45
-21.13%
jan 1, 1996
25.375
+5.028
24.71%
jan 1, 2002
0.0
-25.375
-100.0%
jan 1, 2003
24.633
+24.633
%
jan 1, 2004
24.544
-0.089
-0.36%
jan 1, 2005
16.335
-8.21
-33.45%
jan 1, 2006
23.552
+7.218
44.19%
jan 1, 2008
26.169
+2.617
11.11%
jan 1, 2009
28.772
+2.603
9.95%
jan 1, 2010
31.248
+2.476
8.61%
jan 1, 2011
32.154
+0.906
2.9%
jan 1, 2012
34.688
+2.534
7.88%
jan 1, 2013
34.854
+0.166
0.48%
jan 1, 2014
34.758
-0.096
-0.27%
jan 1, 2015
34.883
+0.125
0.36%
Ranking of countries by current statistics by years


Comments: