29
/
en
AIzaSyAYiBZKx7MnpbEhh9jyipgxe19OcubqV5w
April 1, 2024
86374
Bhutan
BTN
true
2
1
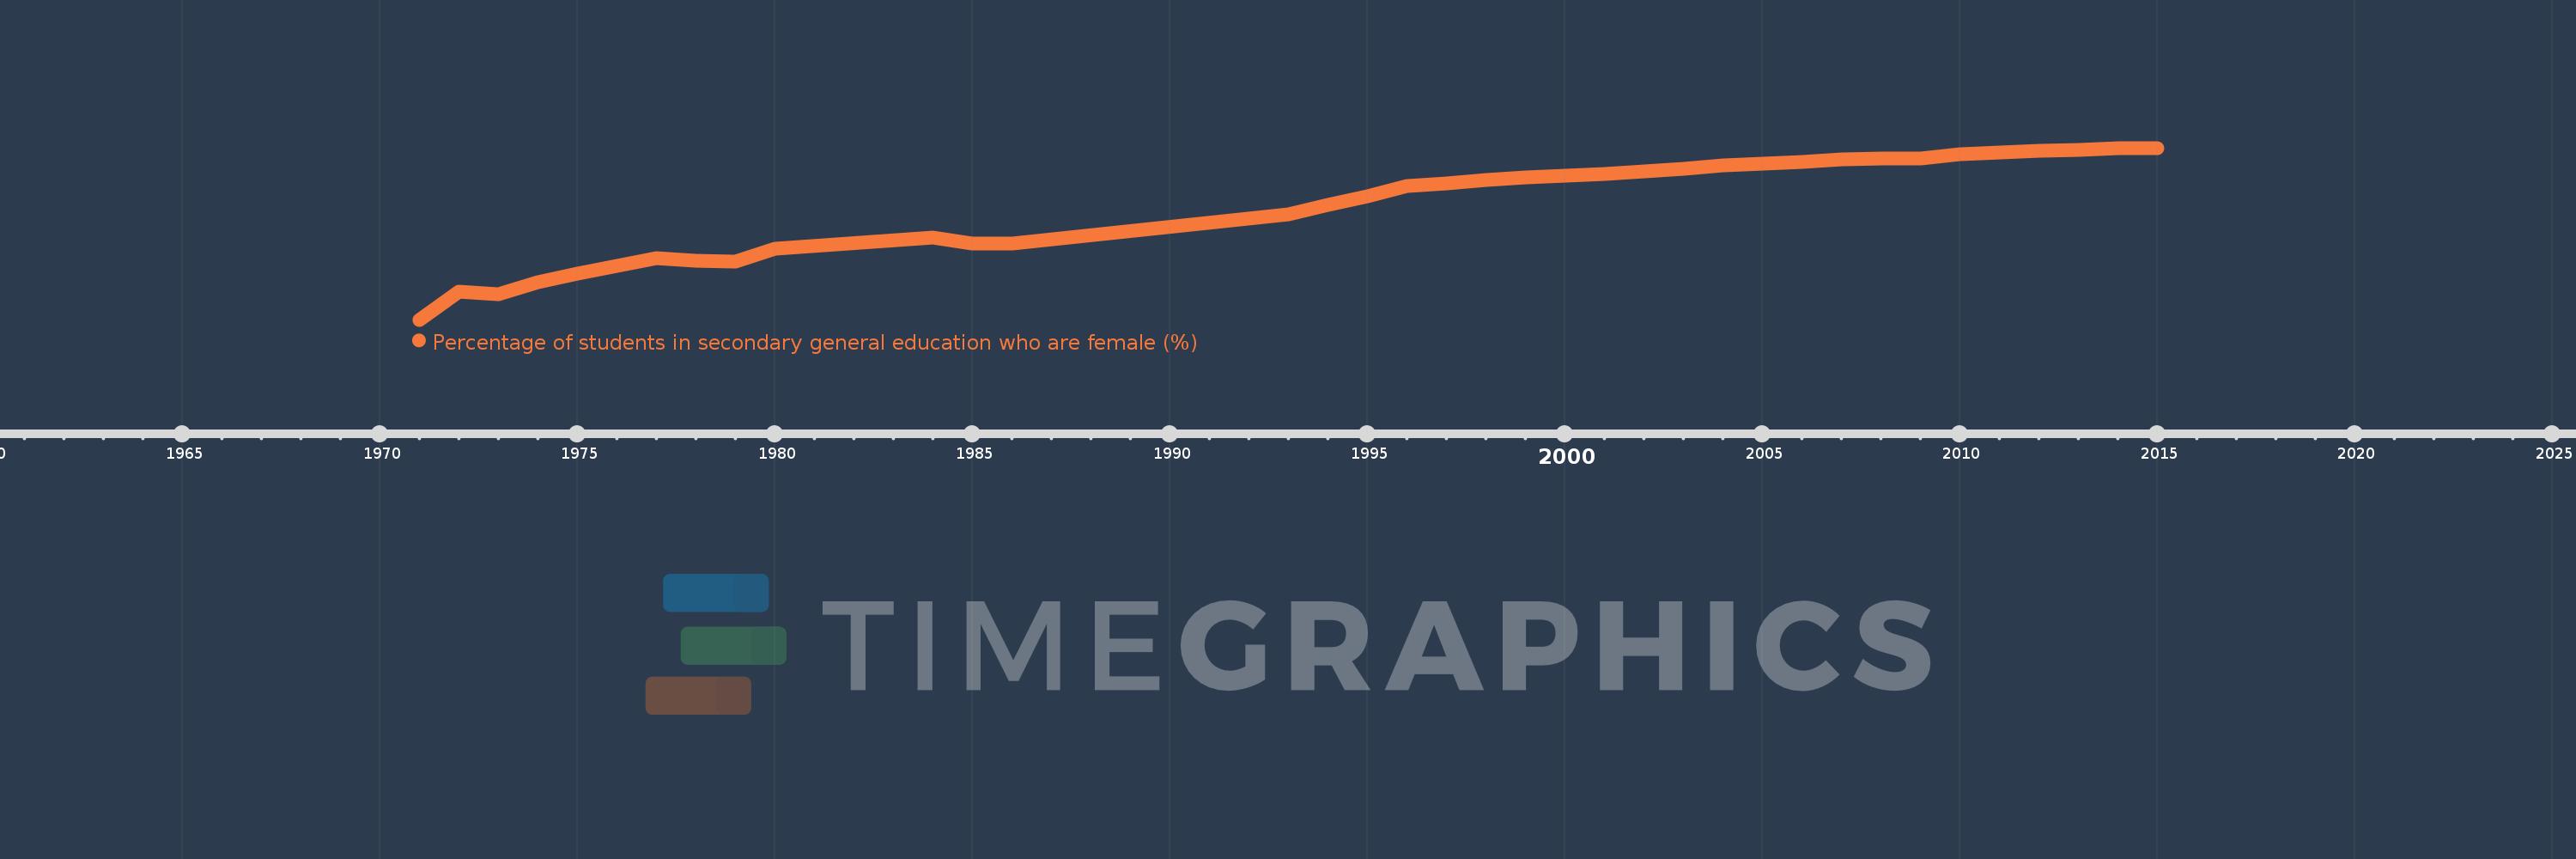
Percentage of students in secondary general education who are female (%)
2015,2014,2013,2012,2011,2010,2009,2008,2007,2006,2005,2004,2003,2002,2001,2000,1999,1998,1997,1996,1995,1994,1993,1986,1985,1984,1980,1979,1978,1977,1975,1974,1973,1972,1971
This statistics in other country:
AfghanistanAlbaniaAlgeriaAndorraAngolaAntigua and BarbudaArab WorldArgentinaArmeniaArubaAustraliaAustriaAzerbaijanBahamas, TheBahrainBangladeshBarbadosBelarusBelgiumBelizeBeninBermudaBhutanBoliviaBosnia and HerzegovinaBotswanaBrazilBritish Virgin IslandsBrunei DarussalamBulgariaBurkina FasoBurundiCabo VerdeCambodiaCameroonCanadaCaribbean small statesCayman IslandsCentral African RepublicCentral Europe and the BalticsChadChileChinaColombiaComorosCongo, Dem. Rep.Congo, Rep.Costa RicaCote d'IvoireCroatiaCubaCuracaoCyprusCzech RepublicDenmarkDjiboutiDominicaDominican RepublicEarly-demographic dividendEast Asia & PacificEast Asia & Pacific (excluding high income)East Asia & Pacific (IDA & IBRD countries)EcuadorEgypt, Arab Rep.El SalvadorEquatorial GuineaEritreaEstoniaEthiopiaEuro areaEurope & Central AsiaEurope & Central Asia (excluding high income)Europe & Central Asia (IDA & IBRD countries)European UnionFijiFinlandFragile and conflict affected situationsFranceGabonGambia, TheGeorgiaGermanyGhanaGibraltarGreeceGrenadaGuatemalaGuineaGuinea-BissauGuyanaHaitiHeavily indebted poor countries (HIPC)High incomeHondurasHong Kong SAR, ChinaHungaryIBRD onlyIcelandIDA & IBRD totalIDA blendIDA onlyIDA totalIndiaIndonesiaIran, Islamic Rep.IraqIrelandIsraelItalyJamaicaJapanJordanKazakhstanKenyaKiribatiKorea, Dem. People’s Rep.Korea, Rep.KuwaitKyrgyz RepublicLao PDRLate-demographic dividendLatin America & Caribbean Latin America & Caribbean (excluding high income)Latin America & the Caribbean (IDA & IBRD countries)LatviaLeast developed countries: UN classificationLebanonLesothoLiberiaLibyaLiechtensteinLithuaniaLow & middle incomeLow incomeLower middle incomeLuxembourgMacao SAR, ChinaMacedonia, FYRMadagascarMalawiMalaysiaMaldivesMaliMaltaMarshall IslandsMauritaniaMauritiusMexicoMicronesia, Fed. Sts.Middle East & North AfricaMiddle East & North Africa (excluding high income)Middle East & North Africa (IDA & IBRD countries)Middle incomeMoldovaMonacoMongoliaMontenegroMoroccoMozambiqueMyanmarNamibiaNauruNepalNetherlandsNew ZealandNicaraguaNigerNigeriaNorth AmericaNorwayOECD membersOmanOther small statesPacific island small statesPakistanPalauPanamaPapua New GuineaParaguayPeruPhilippinesPolandPortugalPost-demographic dividendPre-demographic dividendPuerto RicoQatarRomaniaRussian FederationRwandaSamoaSan MarinoSao Tome and PrincipeSaudi ArabiaSenegalSerbiaSeychellesSierra LeoneSingaporeSint Maarten (Dutch part)Slovak RepublicSloveniaSmall statesSolomon IslandsSomaliaSouth AfricaSouth AsiaSouth Asia (IDA & IBRD)South SudanSpainSri LankaSt. Kitts and NevisSt. LuciaSt. Vincent and the GrenadinesSub-Saharan Africa Sub-Saharan Africa (excluding high income)Sub-Saharan Africa (IDA & IBRD countries)SudanSurinameSwazilandSwedenSwitzerlandSyrian Arab RepublicTajikistanTanzaniaThailandTimor-LesteTogoTongaTrinidad and TobagoTunisiaTurkeyTurkmenistanTurks and Caicos IslandsTuvaluUgandaUkraineUnited Arab EmiratesUnited KingdomUnited StatesUpper middle incomeUruguayUzbekistanVanuatuVenezuela, RBVietnamWest Bank and GazaWorldYemen, Rep.ZambiaZimbabwe Timeline:
This timeline shows a graph from 1971 to 2015 of Bhutan. No data until 1970. Number of actual observations by date: 35.
Source name:
World Development Indicators
Source organization:
UNESCO Institute for Statistics
Categories, topics:
Education, Gender
Last updated:
apr 23, 2017
Indicators value changes by year
Maximum:
51.222
jan 1, 2015
At the date of observation
Value
Absolute change
Change from previous value
jan 1, 1971
2.545
+2.545
0.0%
jan 1, 1972
10.615
+8.07
317.15%
jan 1, 1973
9.796
-0.819
-7.71%
jan 1, 1974
13.151
+3.355
34.25%
jan 1, 1975
15.56
+2.408
18.31%
jan 1, 1977
20.073
+4.514
29.01%
jan 1, 1978
19.333
-0.741
-3.69%
jan 1, 1979
19.13
-0.202
-1.05%
jan 1, 1980
22.782
+3.652
19.09%
jan 1, 1984
25.796
+3.014
13.23%
jan 1, 1985
24.224
-1.572
-6.09%
jan 1, 1986
24.127
-0.097
-0.4%
jan 1, 1993
32.484
+8.357
34.64%
jan 1, 1994
34.983
+2.499
7.69%
jan 1, 1995
37.437
+2.455
7.02%
jan 1, 1996
40.398
+2.961
7.91%
jan 1, 1997
41.281
+0.883
2.19%
jan 1, 1998
42.247
+0.967
2.34%
jan 1, 1999
42.855
+0.607
1.44%
jan 1, 2000
43.316
+0.461
1.08%
jan 1, 2001
43.833
+0.517
1.19%
jan 1, 2002
44.603
+0.769
1.75%
jan 1, 2003
45.359
+0.756
1.7%
jan 1, 2004
46.242
+0.883
1.95%
jan 1, 2005
46.732
+0.49
1.06%
jan 1, 2006
47.353
+0.621
1.33%
jan 1, 2007
47.969
+0.617
1.3%
jan 1, 2008
48.35
+0.381
0.79%
jan 1, 2009
48.167
-0.183
-0.38%
jan 1, 2010
49.477
+1.31
2.72%
jan 1, 2011
49.88
+0.403
0.81%
jan 1, 2012
50.406
+0.526
1.05%
jan 1, 2013
50.713
+0.307
0.61%
jan 1, 2014
51.097
+0.385
0.76%
jan 1, 2015
51.222
+0.125
0.24%
Ranking of countries by current statistics by years


Comments: