29
/
en
AIzaSyAYiBZKx7MnpbEhh9jyipgxe19OcubqV5w
April 1, 2024
39342
IDA only
IDX
false
2
1
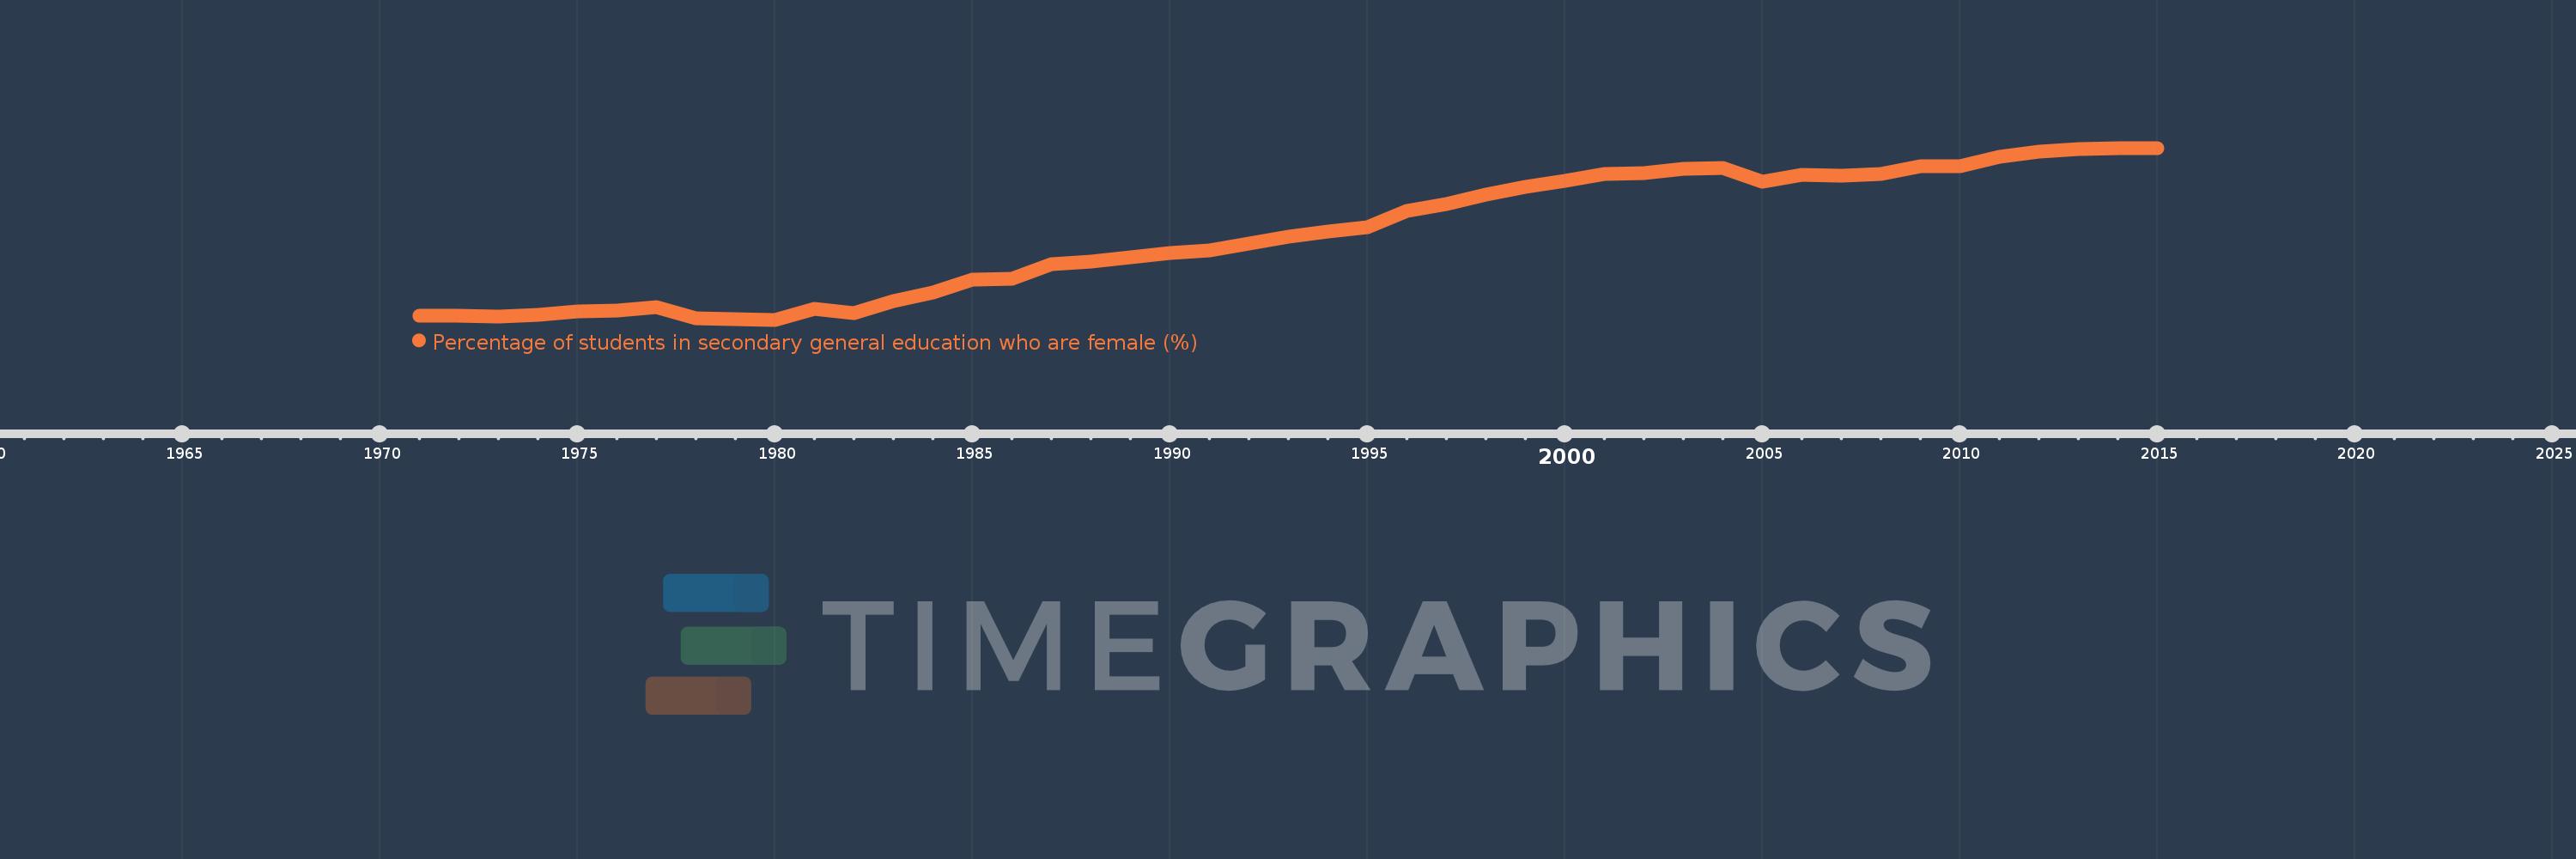
Percentage of students in secondary general education who are female (%)
2015,2014,2013,2012,2011,2010,2009,2008,2007,2006,2005,2004,2003,2002,2001,2000,1999,1998,1997,1996,1995,1994,1993,1992,1991,1990,1989,1988,1987,1986,1985,1984,1983,1982,1981,1980,1979,1978,1977,1976,1975,1974,1973,1972,1971
This statistics in other country:
AfghanistanAlbaniaAlgeriaAndorraAngolaAntigua and BarbudaArab WorldArgentinaArmeniaArubaAustraliaAustriaAzerbaijanBahamas, TheBahrainBangladeshBarbadosBelarusBelgiumBelizeBeninBermudaBhutanBoliviaBosnia and HerzegovinaBotswanaBrazilBritish Virgin IslandsBrunei DarussalamBulgariaBurkina FasoBurundiCabo VerdeCambodiaCameroonCanadaCaribbean small statesCayman IslandsCentral African RepublicCentral Europe and the BalticsChadChileChinaColombiaComorosCongo, Dem. Rep.Congo, Rep.Costa RicaCote d'IvoireCroatiaCubaCuracaoCyprusCzech RepublicDenmarkDjiboutiDominicaDominican RepublicEarly-demographic dividendEast Asia & PacificEast Asia & Pacific (excluding high income)East Asia & Pacific (IDA & IBRD countries)EcuadorEgypt, Arab Rep.El SalvadorEquatorial GuineaEritreaEstoniaEthiopiaEuro areaEurope & Central AsiaEurope & Central Asia (excluding high income)Europe & Central Asia (IDA & IBRD countries)European UnionFijiFinlandFragile and conflict affected situationsFranceGabonGambia, TheGeorgiaGermanyGhanaGibraltarGreeceGrenadaGuatemalaGuineaGuinea-BissauGuyanaHaitiHeavily indebted poor countries (HIPC)High incomeHondurasHong Kong SAR, ChinaHungaryIBRD onlyIcelandIDA & IBRD totalIDA blendIDA onlyIDA totalIndiaIndonesiaIran, Islamic Rep.IraqIrelandIsraelItalyJamaicaJapanJordanKazakhstanKenyaKiribatiKorea, Dem. People’s Rep.Korea, Rep.KuwaitKyrgyz RepublicLao PDRLate-demographic dividendLatin America & Caribbean Latin America & Caribbean (excluding high income)Latin America & the Caribbean (IDA & IBRD countries)LatviaLeast developed countries: UN classificationLebanonLesothoLiberiaLibyaLiechtensteinLithuaniaLow & middle incomeLow incomeLower middle incomeLuxembourgMacao SAR, ChinaMacedonia, FYRMadagascarMalawiMalaysiaMaldivesMaliMaltaMarshall IslandsMauritaniaMauritiusMexicoMicronesia, Fed. Sts.Middle East & North AfricaMiddle East & North Africa (excluding high income)Middle East & North Africa (IDA & IBRD countries)Middle incomeMoldovaMonacoMongoliaMontenegroMoroccoMozambiqueMyanmarNamibiaNauruNepalNetherlandsNew ZealandNicaraguaNigerNigeriaNorth AmericaNorwayOECD membersOmanOther small statesPacific island small statesPakistanPalauPanamaPapua New GuineaParaguayPeruPhilippinesPolandPortugalPost-demographic dividendPre-demographic dividendPuerto RicoQatarRomaniaRussian FederationRwandaSamoaSan MarinoSao Tome and PrincipeSaudi ArabiaSenegalSerbiaSeychellesSierra LeoneSingaporeSint Maarten (Dutch part)Slovak RepublicSloveniaSmall statesSolomon IslandsSomaliaSouth AfricaSouth AsiaSouth Asia (IDA & IBRD)South SudanSpainSri LankaSt. Kitts and NevisSt. LuciaSt. Vincent and the GrenadinesSub-Saharan Africa Sub-Saharan Africa (excluding high income)Sub-Saharan Africa (IDA & IBRD countries)SudanSurinameSwazilandSwedenSwitzerlandSyrian Arab RepublicTajikistanTanzaniaThailandTimor-LesteTogoTongaTrinidad and TobagoTunisiaTurkeyTurkmenistanTurks and Caicos IslandsTuvaluUgandaUkraineUnited Arab EmiratesUnited KingdomUnited StatesUpper middle incomeUruguayUzbekistanVanuatuVenezuela, RBVietnamWest Bank and GazaWorldYemen, Rep.ZambiaZimbabwe Timeline:
This timeline shows a graph from 1971 to 2015 of IDA only. No data until 1970. Number of actual observations by date: 45.
Source name:
World Development Indicators
Source organization:
UNESCO Institute for Statistics
Categories, topics:
Education, Gender
Last updated:
apr 23, 2017
Indicators value changes by year
Minimum:
33.631
jan 1, 1980
Maximum:
46.722
jan 1, 2015
At the date of observation
Value
Absolute change
Change from previous value
jan 1, 1971
33.92
+33.92
0.0%
jan 1, 1972
33.917
-0.003
-0.01%
jan 1, 1973
33.853
-0.064
-0.19%
jan 1, 1974
33.976
+0.122
0.36%
jan 1, 1975
34.236
+0.261
0.77%
jan 1, 1976
34.316
+0.08
0.23%
jan 1, 1977
34.579
+0.264
0.77%
jan 1, 1978
33.763
-0.817
-2.36%
jan 1, 1979
33.647
-0.115
-0.34%
jan 1, 1980
33.631
-0.017
-0.05%
jan 1, 1981
34.49
+0.86
2.56%
jan 1, 1982
34.133
-0.358
-1.04%
jan 1, 1983
35.072
+0.939
2.75%
jan 1, 1984
35.735
+0.663
1.89%
jan 1, 1985
36.669
+0.934
2.61%
jan 1, 1986
36.771
+0.102
0.28%
jan 1, 1987
37.85
+1.079
2.93%
jan 1, 1988
38.04
+0.19
0.5%
jan 1, 1989
38.4
+0.36
0.95%
jan 1, 1990
38.721
+0.321
0.84%
jan 1, 1991
38.896
+0.175
0.45%
jan 1, 1992
39.436
+0.54
1.39%
jan 1, 1993
39.961
+0.525
1.33%
jan 1, 1994
40.373
+0.412
1.03%
jan 1, 1995
40.693
+0.32
0.79%
jan 1, 1996
41.909
+1.216
2.99%
jan 1, 1997
42.456
+0.547
1.3%
jan 1, 1998
43.155
+0.699
1.65%
jan 1, 1999
43.728
+0.573
1.33%
jan 1, 2000
44.236
+0.508
1.16%
jan 1, 2001
44.72
+0.484
1.09%
jan 1, 2002
44.816
+0.096
0.21%
jan 1, 2003
45.112
+0.296
0.66%
jan 1, 2004
45.187
+0.074
0.16%
jan 1, 2005
44.179
-1.008
-2.23%
jan 1, 2006
44.683
+0.504
1.14%
jan 1, 2007
44.594
-0.089
-0.2%
jan 1, 2008
44.741
+0.147
0.33%
jan 1, 2009
45.355
+0.614
1.37%
jan 1, 2010
45.32
-0.035
-0.08%
jan 1, 2011
46.054
+0.734
1.62%
jan 1, 2012
46.467
+0.413
0.9%
jan 1, 2013
46.669
+0.202
0.43%
jan 1, 2014
46.715
+0.046
0.1%
jan 1, 2015
46.722
+0.007
0.02%
Ranking of countries by current statistics by years


Comments: