29
/
en
AIzaSyAYiBZKx7MnpbEhh9jyipgxe19OcubqV5w
April 1, 2024
276050
United Kingdom
GBR
true
2
1
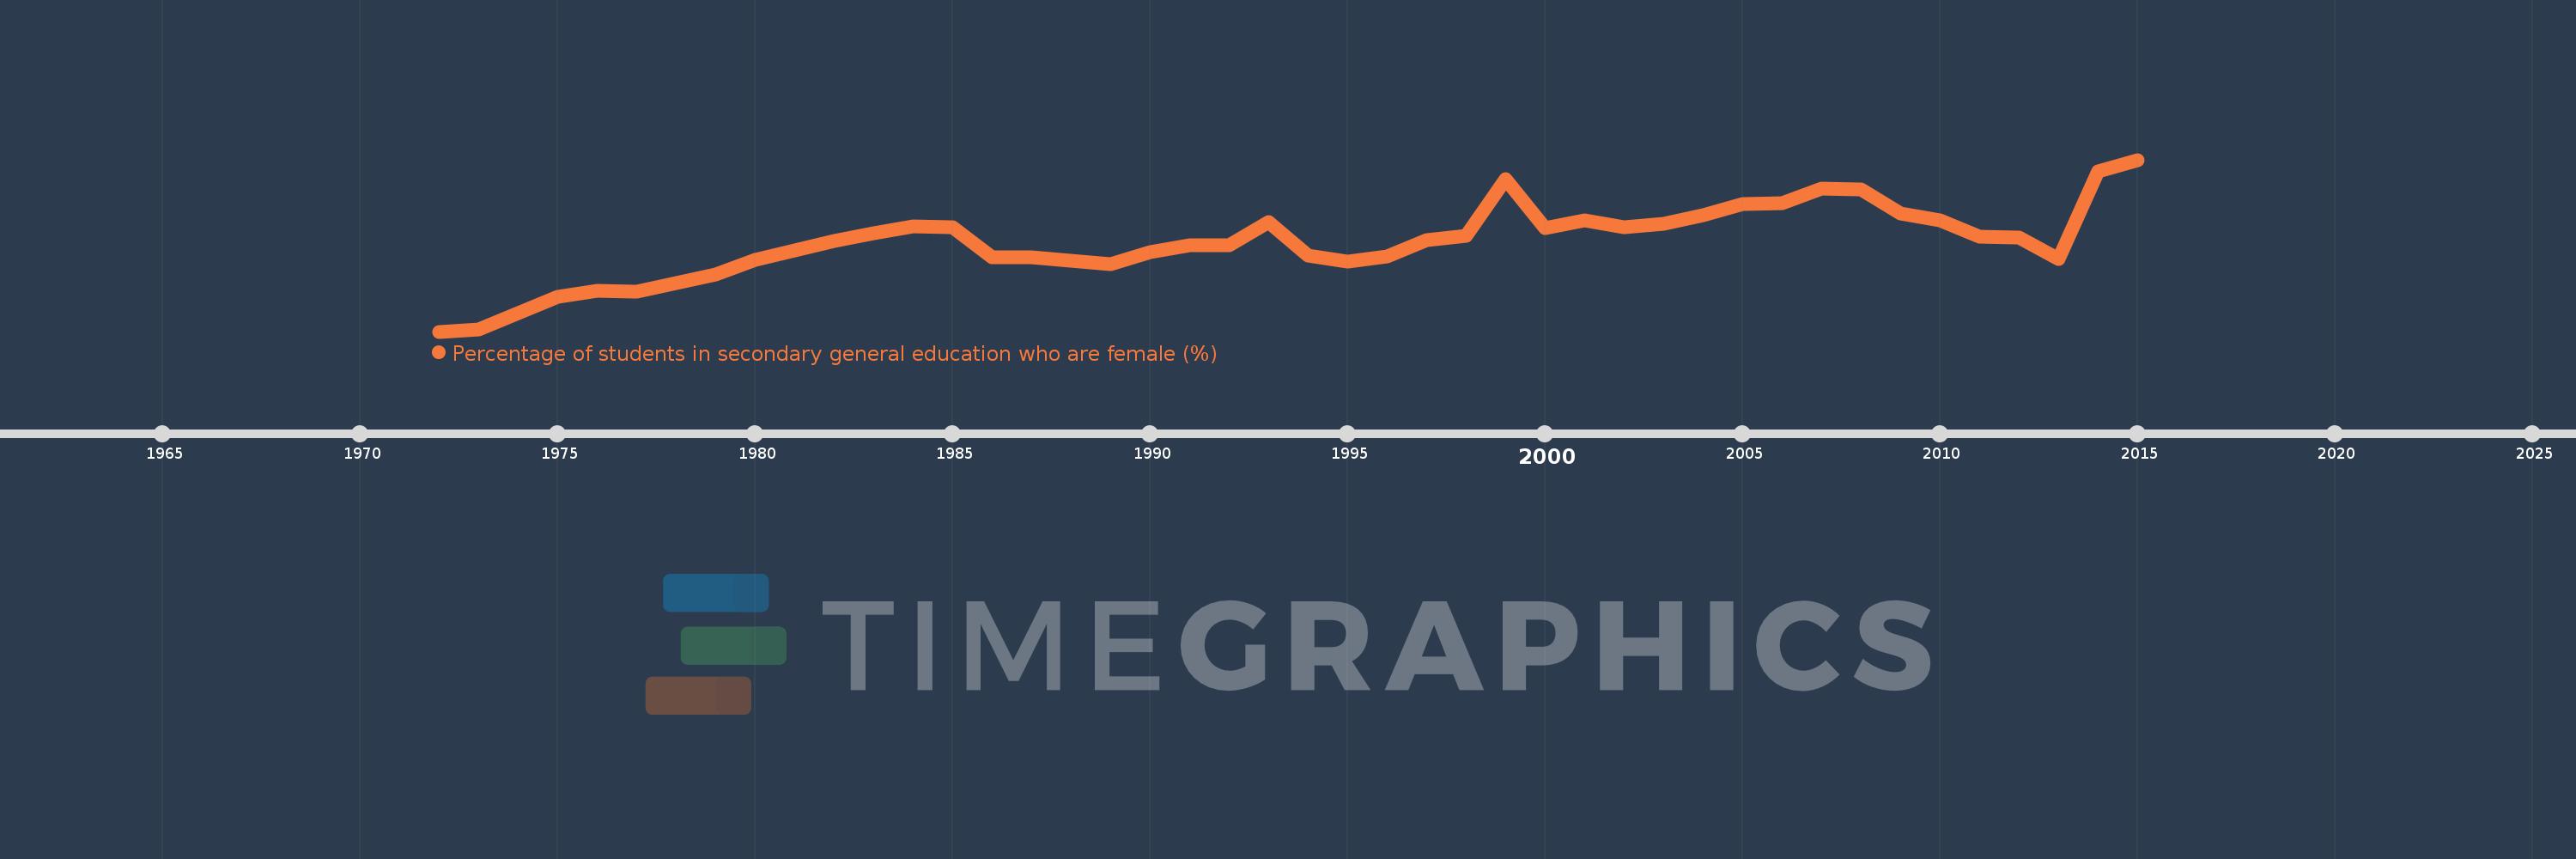
Percentage of students in secondary general education who are female (%)
2015,2014,2013,2012,2011,2010,2009,2008,2007,2006,2005,2004,2003,2002,2001,2000,1999,1998,1997,1996,1995,1994,1993,1992,1991,1990,1989,1988,1987,1986,1985,1984,1983,1982,1981,1980,1979,1978,1977,1976,1975,1974,1973,1972
This statistics in other country:
AfghanistanAlbaniaAlgeriaAndorraAngolaAntigua and BarbudaArab WorldArgentinaArmeniaArubaAustraliaAustriaAzerbaijanBahamas, TheBahrainBangladeshBarbadosBelarusBelgiumBelizeBeninBermudaBhutanBoliviaBosnia and HerzegovinaBotswanaBrazilBritish Virgin IslandsBrunei DarussalamBulgariaBurkina FasoBurundiCabo VerdeCambodiaCameroonCanadaCaribbean small statesCayman IslandsCentral African RepublicCentral Europe and the BalticsChadChileChinaColombiaComorosCongo, Dem. Rep.Congo, Rep.Costa RicaCote d'IvoireCroatiaCubaCuracaoCyprusCzech RepublicDenmarkDjiboutiDominicaDominican RepublicEarly-demographic dividendEast Asia & PacificEast Asia & Pacific (excluding high income)East Asia & Pacific (IDA & IBRD countries)EcuadorEgypt, Arab Rep.El SalvadorEquatorial GuineaEritreaEstoniaEthiopiaEuro areaEurope & Central AsiaEurope & Central Asia (excluding high income)Europe & Central Asia (IDA & IBRD countries)European UnionFijiFinlandFragile and conflict affected situationsFranceGabonGambia, TheGeorgiaGermanyGhanaGibraltarGreeceGrenadaGuatemalaGuineaGuinea-BissauGuyanaHaitiHeavily indebted poor countries (HIPC)High incomeHondurasHong Kong SAR, ChinaHungaryIBRD onlyIcelandIDA & IBRD totalIDA blendIDA onlyIDA totalIndiaIndonesiaIran, Islamic Rep.IraqIrelandIsraelItalyJamaicaJapanJordanKazakhstanKenyaKiribatiKorea, Dem. People’s Rep.Korea, Rep.KuwaitKyrgyz RepublicLao PDRLate-demographic dividendLatin America & Caribbean Latin America & Caribbean (excluding high income)Latin America & the Caribbean (IDA & IBRD countries)LatviaLeast developed countries: UN classificationLebanonLesothoLiberiaLibyaLiechtensteinLithuaniaLow & middle incomeLow incomeLower middle incomeLuxembourgMacao SAR, ChinaMacedonia, FYRMadagascarMalawiMalaysiaMaldivesMaliMaltaMarshall IslandsMauritaniaMauritiusMexicoMicronesia, Fed. Sts.Middle East & North AfricaMiddle East & North Africa (excluding high income)Middle East & North Africa (IDA & IBRD countries)Middle incomeMoldovaMonacoMongoliaMontenegroMoroccoMozambiqueMyanmarNamibiaNauruNepalNetherlandsNew ZealandNicaraguaNigerNigeriaNorth AmericaNorwayOECD membersOmanOther small statesPacific island small statesPakistanPalauPanamaPapua New GuineaParaguayPeruPhilippinesPolandPortugalPost-demographic dividendPre-demographic dividendPuerto RicoQatarRomaniaRussian FederationRwandaSamoaSan MarinoSao Tome and PrincipeSaudi ArabiaSenegalSerbiaSeychellesSierra LeoneSingaporeSint Maarten (Dutch part)Slovak RepublicSloveniaSmall statesSolomon IslandsSomaliaSouth AfricaSouth AsiaSouth Asia (IDA & IBRD)South SudanSpainSri LankaSt. Kitts and NevisSt. LuciaSt. Vincent and the GrenadinesSub-Saharan Africa Sub-Saharan Africa (excluding high income)Sub-Saharan Africa (IDA & IBRD countries)SudanSurinameSwazilandSwedenSwitzerlandSyrian Arab RepublicTajikistanTanzaniaThailandTimor-LesteTogoTongaTrinidad and TobagoTunisiaTurkeyTurkmenistanTurks and Caicos IslandsTuvaluUgandaUkraineUnited Arab EmiratesUnited KingdomUnited StatesUpper middle incomeUruguayUzbekistanVanuatuVenezuela, RBVietnamWest Bank and GazaWorldYemen, Rep.ZambiaZimbabwe Timeline:
This timeline shows a graph from 1972 to 2015 of United Kingdom. No data until 1971. Number of actual observations by date: 44.
Source name:
World Development Indicators
Source organization:
UNESCO Institute for Statistics
Categories, topics:
Education, Gender
Last updated:
apr 23, 2017
Indicators value changes by year
Minimum:
48.519
jan 1, 1972
Maximum:
49.671
jan 1, 2015
At the date of observation
Value
Absolute change
Change from previous value
jan 1, 1972
48.519
+48.519
0.0%
jan 1, 1973
48.536
+0.017
0.04%
jan 1, 1974
48.641
+0.104
0.22%
jan 1, 1975
48.75
+0.109
0.22%
jan 1, 1976
48.794
+0.045
0.09%
jan 1, 1977
48.789
-0.005
-0.01%
jan 1, 1978
48.846
+0.056
0.12%
jan 1, 1979
48.902
+0.056
0.12%
jan 1, 1980
49.001
+0.098
0.2%
jan 1, 1981
49.066
+0.065
0.13%
jan 1, 1982
49.125
+0.059
0.12%
jan 1, 1983
49.178
+0.053
0.11%
jan 1, 1984
49.226
+0.048
0.1%
jan 1, 1985
49.219
-0.008
-0.02%
jan 1, 1986
49.016
-0.203
-0.41%
jan 1, 1987
49.017
+0.001
0.0%
jan 1, 1988
48.993
-0.024
-0.05%
jan 1, 1989
48.972
-0.021
-0.04%
jan 1, 1990
49.054
+0.082
0.17%
jan 1, 1991
49.1
+0.046
0.09%
jan 1, 1993
49.255
+0.155
0.31%
jan 1, 1994
49.028
-0.226
-0.46%
jan 1, 1995
48.989
-0.039
-0.08%
jan 1, 1996
49.022
+0.032
0.07%
jan 1, 1997
49.131
+0.109
0.22%
jan 1, 1998
49.159
+0.028
0.06%
jan 1, 1999
49.542
+0.383
0.78%
jan 1, 2000
49.211
-0.331
-0.67%
jan 1, 2001
49.265
+0.054
0.11%
jan 1, 2002
49.22
-0.045
-0.09%
jan 1, 2003
49.243
+0.023
0.05%
jan 1, 2004
49.299
+0.055
0.11%
jan 1, 2005
49.372
+0.073
0.15%
jan 1, 2006
49.383
+0.012
0.02%
jan 1, 2007
49.476
+0.092
0.19%
jan 1, 2008
49.475
-0.001
0.0%
jan 1, 2009
49.311
-0.164
-0.33%
jan 1, 2010
49.266
-0.045
-0.09%
jan 1, 2011
49.156
-0.111
-0.22%
jan 1, 2012
49.148
-0.008
-0.02%
jan 1, 2013
49.007
-0.141
-0.29%
jan 1, 2014
49.596
+0.589
1.2%
jan 1, 2015
49.671
+0.075
0.15%
Ranking of countries by current statistics by years


Comments: