29
/
en
AIzaSyAYiBZKx7MnpbEhh9jyipgxe19OcubqV5w
April 1, 2024
251183
St. Lucia
LCA
true
2
1
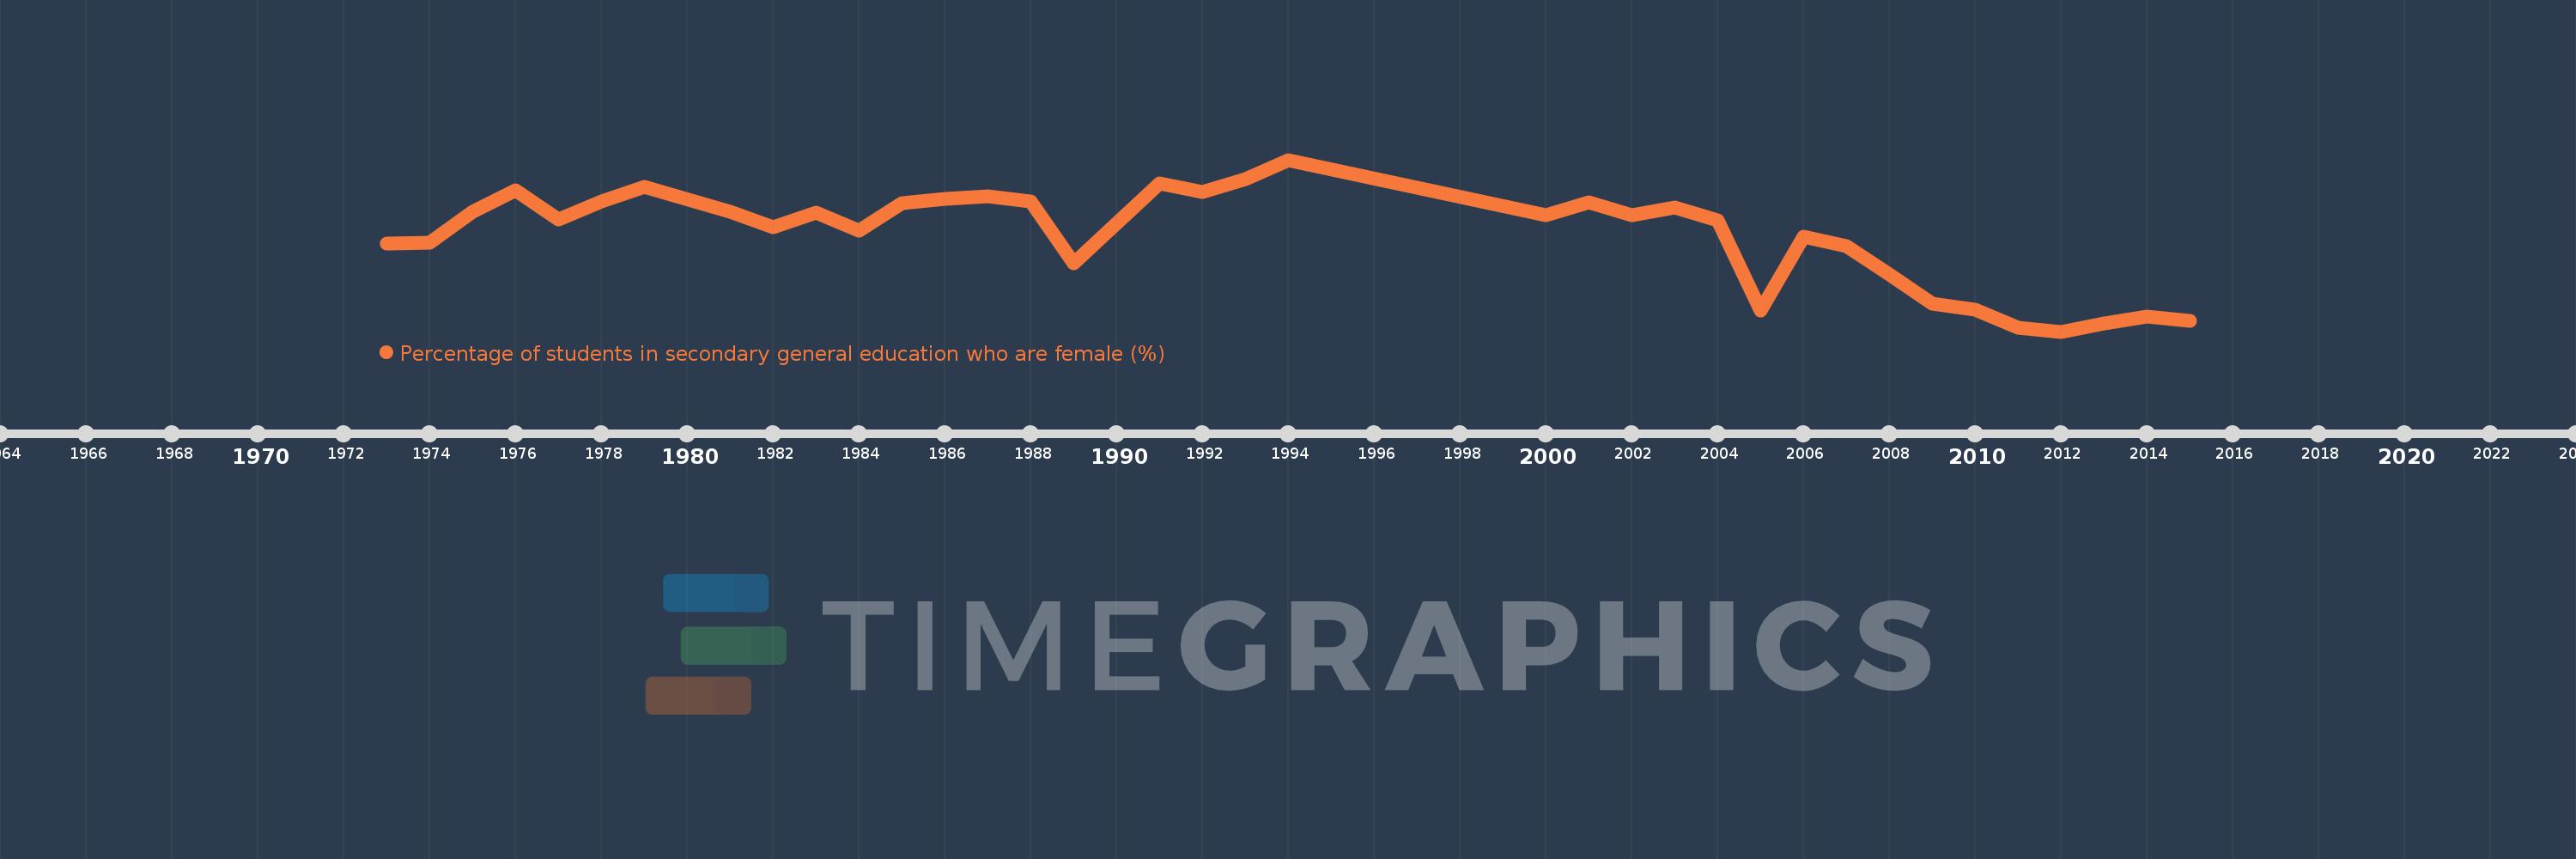
Percentage of students in secondary general education who are female (%)
2015,2014,2013,2012,2011,2010,2009,2008,2007,2006,2005,2004,2003,2002,2001,2000,1994,1993,1992,1991,1989,1988,1987,1986,1985,1984,1983,1982,1981,1979,1978,1977,1976,1975,1974,1973
This statistics in other country:
AfghanistanAlbaniaAlgeriaAndorraAngolaAntigua and BarbudaArab WorldArgentinaArmeniaArubaAustraliaAustriaAzerbaijanBahamas, TheBahrainBangladeshBarbadosBelarusBelgiumBelizeBeninBermudaBhutanBoliviaBosnia and HerzegovinaBotswanaBrazilBritish Virgin IslandsBrunei DarussalamBulgariaBurkina FasoBurundiCabo VerdeCambodiaCameroonCanadaCaribbean small statesCayman IslandsCentral African RepublicCentral Europe and the BalticsChadChileChinaColombiaComorosCongo, Dem. Rep.Congo, Rep.Costa RicaCote d'IvoireCroatiaCubaCuracaoCyprusCzech RepublicDenmarkDjiboutiDominicaDominican RepublicEarly-demographic dividendEast Asia & PacificEast Asia & Pacific (excluding high income)East Asia & Pacific (IDA & IBRD countries)EcuadorEgypt, Arab Rep.El SalvadorEquatorial GuineaEritreaEstoniaEthiopiaEuro areaEurope & Central AsiaEurope & Central Asia (excluding high income)Europe & Central Asia (IDA & IBRD countries)European UnionFijiFinlandFragile and conflict affected situationsFranceGabonGambia, TheGeorgiaGermanyGhanaGibraltarGreeceGrenadaGuatemalaGuineaGuinea-BissauGuyanaHaitiHeavily indebted poor countries (HIPC)High incomeHondurasHong Kong SAR, ChinaHungaryIBRD onlyIcelandIDA & IBRD totalIDA blendIDA onlyIDA totalIndiaIndonesiaIran, Islamic Rep.IraqIrelandIsraelItalyJamaicaJapanJordanKazakhstanKenyaKiribatiKorea, Dem. People’s Rep.Korea, Rep.KuwaitKyrgyz RepublicLao PDRLate-demographic dividendLatin America & Caribbean Latin America & Caribbean (excluding high income)Latin America & the Caribbean (IDA & IBRD countries)LatviaLeast developed countries: UN classificationLebanonLesothoLiberiaLibyaLiechtensteinLithuaniaLow & middle incomeLow incomeLower middle incomeLuxembourgMacao SAR, ChinaMacedonia, FYRMadagascarMalawiMalaysiaMaldivesMaliMaltaMarshall IslandsMauritaniaMauritiusMexicoMicronesia, Fed. Sts.Middle East & North AfricaMiddle East & North Africa (excluding high income)Middle East & North Africa (IDA & IBRD countries)Middle incomeMoldovaMonacoMongoliaMontenegroMoroccoMozambiqueMyanmarNamibiaNauruNepalNetherlandsNew ZealandNicaraguaNigerNigeriaNorth AmericaNorwayOECD membersOmanOther small statesPacific island small statesPakistanPalauPanamaPapua New GuineaParaguayPeruPhilippinesPolandPortugalPost-demographic dividendPre-demographic dividendPuerto RicoQatarRomaniaRussian FederationRwandaSamoaSan MarinoSao Tome and PrincipeSaudi ArabiaSenegalSerbiaSeychellesSierra LeoneSingaporeSint Maarten (Dutch part)Slovak RepublicSloveniaSmall statesSolomon IslandsSomaliaSouth AfricaSouth AsiaSouth Asia (IDA & IBRD)South SudanSpainSri LankaSt. Kitts and NevisSt. LuciaSt. Vincent and the GrenadinesSub-Saharan Africa Sub-Saharan Africa (excluding high income)Sub-Saharan Africa (IDA & IBRD countries)SudanSurinameSwazilandSwedenSwitzerlandSyrian Arab RepublicTajikistanTanzaniaThailandTimor-LesteTogoTongaTrinidad and TobagoTunisiaTurkeyTurkmenistanTurks and Caicos IslandsTuvaluUgandaUkraineUnited Arab EmiratesUnited KingdomUnited StatesUpper middle incomeUruguayUzbekistanVanuatuVenezuela, RBVietnamWest Bank and GazaWorldYemen, Rep.ZambiaZimbabwe Timeline:
This timeline shows a graph from 1973 to 2015 of St. Lucia. No data until 1972. Number of actual observations by date: 36.
Source name:
World Development Indicators
Source organization:
UNESCO Institute for Statistics
Categories, topics:
Education, Gender
Last updated:
apr 23, 2017
Indicators value changes by year
Minimum:
49.453
jan 1, 2012
Maximum:
59.791
jan 1, 1994
At the date of observation
Value
Absolute change
Change from previous value
jan 1, 1973
54.752
+54.752
0.0%
jan 1, 1974
54.827
+0.075
0.14%
jan 1, 1975
56.642
+1.815
3.31%
jan 1, 1976
57.977
+1.335
2.36%
jan 1, 1977
56.214
-1.763
-3.04%
jan 1, 1978
57.266
+1.052
1.87%
jan 1, 1979
58.184
+0.919
1.6%
jan 1, 1981
56.671
-1.513
-2.6%
jan 1, 1982
55.736
-0.935
-1.65%
jan 1, 1983
56.598
+0.862
1.55%
jan 1, 1984
55.52
-1.078
-1.91%
jan 1, 1985
57.206
+1.686
3.04%
jan 1, 1986
57.462
+0.256
0.45%
jan 1, 1987
57.573
+0.111
0.19%
jan 1, 1988
57.279
-0.295
-0.51%
jan 1, 1989
53.561
-3.718
-6.49%
jan 1, 1991
58.375
+4.814
8.99%
jan 1, 1992
57.846
-0.528
-0.9%
jan 1, 1993
58.652
+0.805
1.39%
jan 1, 1994
59.791
+1.139
1.94%
jan 1, 2000
56.478
-3.312
-5.54%
jan 1, 2001
57.239
+0.76
1.35%
jan 1, 2002
56.477
-0.762
-1.33%
jan 1, 2003
56.933
+0.457
0.81%
jan 1, 2004
56.136
-0.797
-1.4%
jan 1, 2005
50.699
-5.438
-9.69%
jan 1, 2006
55.148
+4.449
8.78%
jan 1, 2007
54.596
-0.552
-1.0%
jan 1, 2008
52.907
-1.689
-3.09%
jan 1, 2009
51.154
-1.753
-3.31%
jan 1, 2010
50.768
-0.386
-0.75%
jan 1, 2011
49.67
-1.099
-2.16%
jan 1, 2012
49.453
-0.217
-0.44%
jan 1, 2013
49.955
+0.502
1.02%
jan 1, 2014
50.345
+0.39
0.78%
jan 1, 2015
50.1
-0.245
-0.49%
Ranking of countries by current statistics by years


Comments: