29
/
en
AIzaSyAYiBZKx7MnpbEhh9jyipgxe19OcubqV5w
April 1, 2024
92912
Brunei Darussalam
BRN
true
2
1
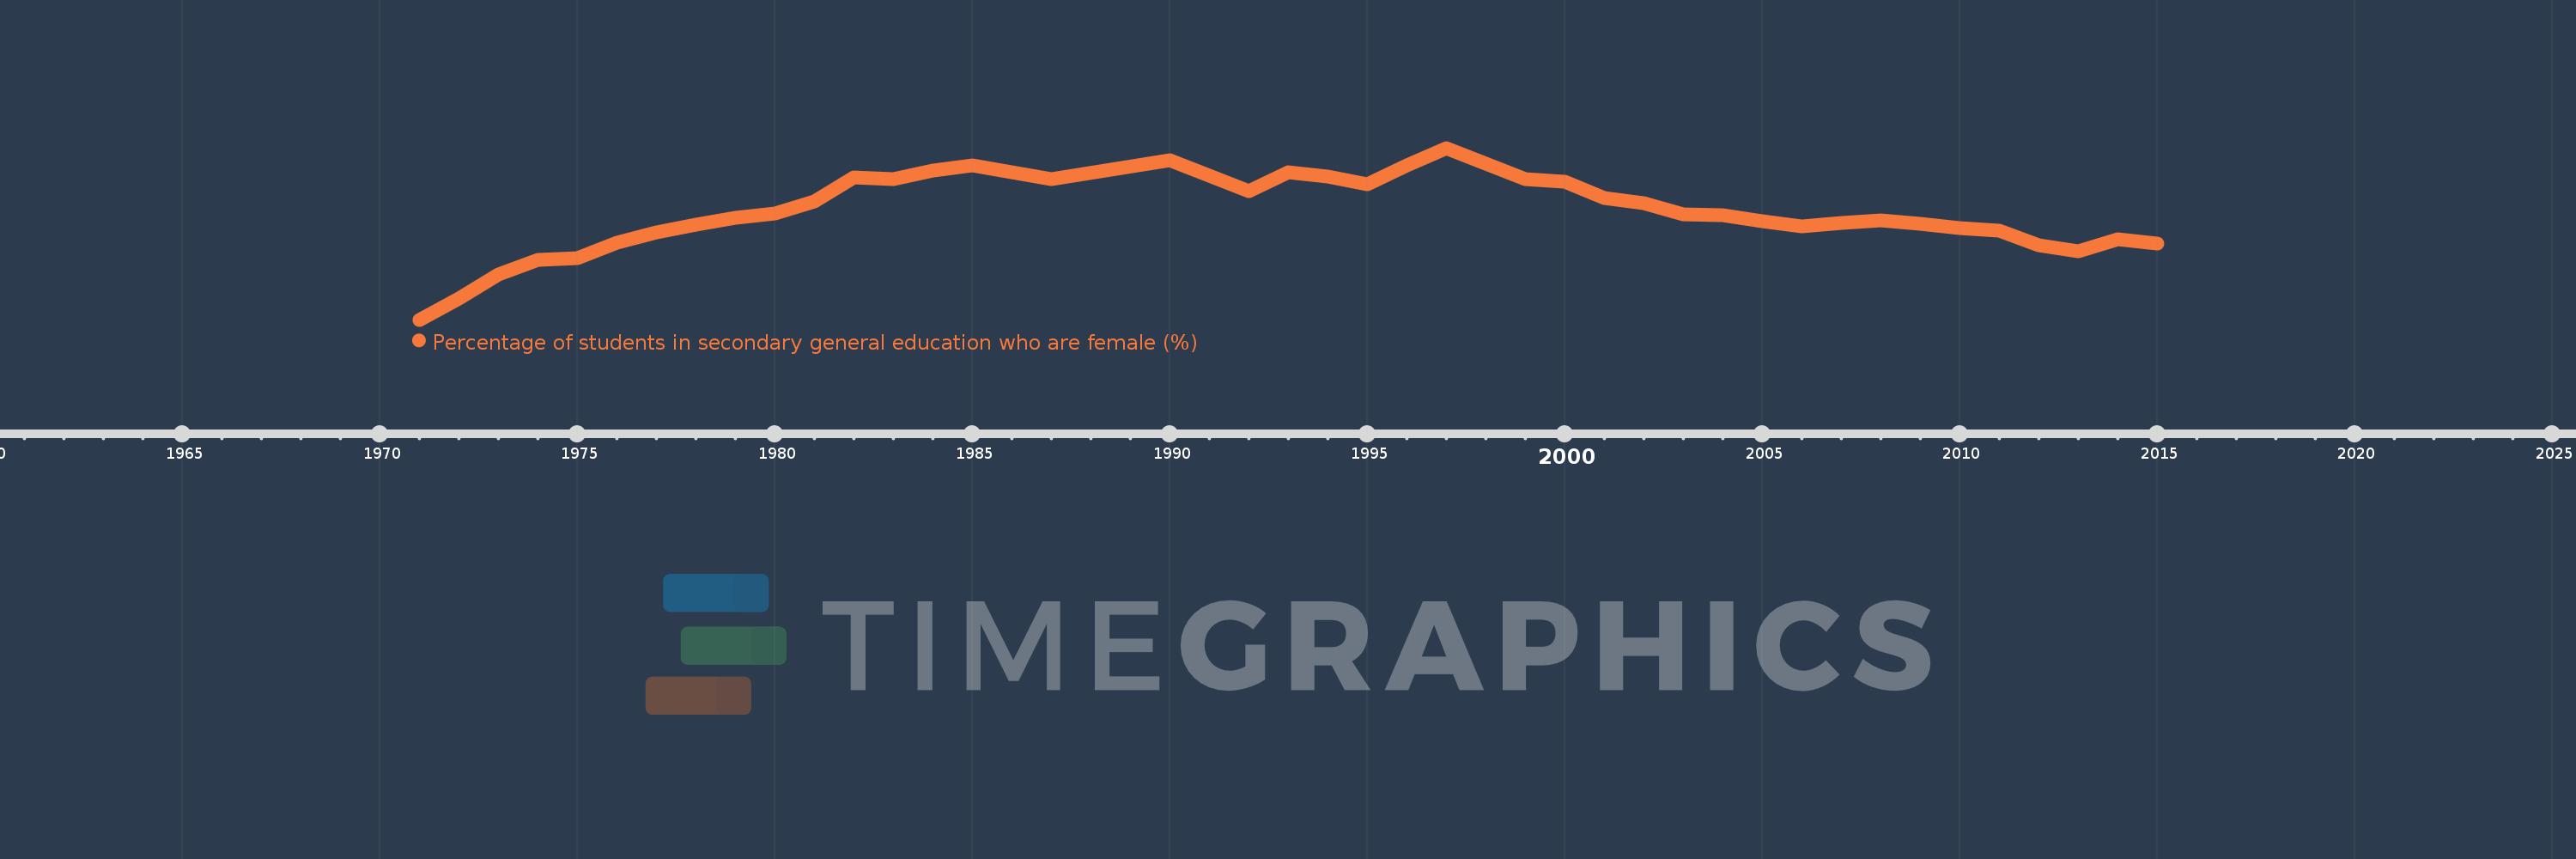
Percentage of students in secondary general education who are female (%)
2015,2014,2013,2012,2011,2010,2009,2008,2007,2006,2005,2004,2003,2002,2001,2000,1999,1997,1996,1995,1994,1993,1992,1990,1987,1985,1984,1983,1982,1981,1980,1979,1978,1977,1976,1975,1974,1973,1972,1971
This statistics in other country:
AfghanistanAlbaniaAlgeriaAndorraAngolaAntigua and BarbudaArab WorldArgentinaArmeniaArubaAustraliaAustriaAzerbaijanBahamas, TheBahrainBangladeshBarbadosBelarusBelgiumBelizeBeninBermudaBhutanBoliviaBosnia and HerzegovinaBotswanaBrazilBritish Virgin IslandsBrunei DarussalamBulgariaBurkina FasoBurundiCabo VerdeCambodiaCameroonCanadaCaribbean small statesCayman IslandsCentral African RepublicCentral Europe and the BalticsChadChileChinaColombiaComorosCongo, Dem. Rep.Congo, Rep.Costa RicaCote d'IvoireCroatiaCubaCuracaoCyprusCzech RepublicDenmarkDjiboutiDominicaDominican RepublicEarly-demographic dividendEast Asia & PacificEast Asia & Pacific (excluding high income)East Asia & Pacific (IDA & IBRD countries)EcuadorEgypt, Arab Rep.El SalvadorEquatorial GuineaEritreaEstoniaEthiopiaEuro areaEurope & Central AsiaEurope & Central Asia (excluding high income)Europe & Central Asia (IDA & IBRD countries)European UnionFijiFinlandFragile and conflict affected situationsFranceGabonGambia, TheGeorgiaGermanyGhanaGibraltarGreeceGrenadaGuatemalaGuineaGuinea-BissauGuyanaHaitiHeavily indebted poor countries (HIPC)High incomeHondurasHong Kong SAR, ChinaHungaryIBRD onlyIcelandIDA & IBRD totalIDA blendIDA onlyIDA totalIndiaIndonesiaIran, Islamic Rep.IraqIrelandIsraelItalyJamaicaJapanJordanKazakhstanKenyaKiribatiKorea, Dem. People’s Rep.Korea, Rep.KuwaitKyrgyz RepublicLao PDRLate-demographic dividendLatin America & Caribbean Latin America & Caribbean (excluding high income)Latin America & the Caribbean (IDA & IBRD countries)LatviaLeast developed countries: UN classificationLebanonLesothoLiberiaLibyaLiechtensteinLithuaniaLow & middle incomeLow incomeLower middle incomeLuxembourgMacao SAR, ChinaMacedonia, FYRMadagascarMalawiMalaysiaMaldivesMaliMaltaMarshall IslandsMauritaniaMauritiusMexicoMicronesia, Fed. Sts.Middle East & North AfricaMiddle East & North Africa (excluding high income)Middle East & North Africa (IDA & IBRD countries)Middle incomeMoldovaMonacoMongoliaMontenegroMoroccoMozambiqueMyanmarNamibiaNauruNepalNetherlandsNew ZealandNicaraguaNigerNigeriaNorth AmericaNorwayOECD membersOmanOther small statesPacific island small statesPakistanPalauPanamaPapua New GuineaParaguayPeruPhilippinesPolandPortugalPost-demographic dividendPre-demographic dividendPuerto RicoQatarRomaniaRussian FederationRwandaSamoaSan MarinoSao Tome and PrincipeSaudi ArabiaSenegalSerbiaSeychellesSierra LeoneSingaporeSint Maarten (Dutch part)Slovak RepublicSloveniaSmall statesSolomon IslandsSomaliaSouth AfricaSouth AsiaSouth Asia (IDA & IBRD)South SudanSpainSri LankaSt. Kitts and NevisSt. LuciaSt. Vincent and the GrenadinesSub-Saharan Africa Sub-Saharan Africa (excluding high income)Sub-Saharan Africa (IDA & IBRD countries)SudanSurinameSwazilandSwedenSwitzerlandSyrian Arab RepublicTajikistanTanzaniaThailandTimor-LesteTogoTongaTrinidad and TobagoTunisiaTurkeyTurkmenistanTurks and Caicos IslandsTuvaluUgandaUkraineUnited Arab EmiratesUnited KingdomUnited StatesUpper middle incomeUruguayUzbekistanVanuatuVenezuela, RBVietnamWest Bank and GazaWorldYemen, Rep.ZambiaZimbabwe Timeline:
This timeline shows a graph from 1971 to 2015 of Brunei Darussalam. No data until 1970. Number of actual observations by date: 40.
Source name:
World Development Indicators
Source organization:
UNESCO Institute for Statistics
Categories, topics:
Education, Gender
Last updated:
apr 23, 2017
Indicators value changes by year
Minimum:
45.303
jan 1, 1971
Maximum:
52.872
jan 1, 1997
At the date of observation
Value
Absolute change
Change from previous value
jan 1, 1971
45.303
+45.303
0.0%
jan 1, 1972
46.233
+0.93
2.05%
jan 1, 1973
47.308
+1.075
2.32%
jan 1, 1974
47.945
+0.637
1.35%
jan 1, 1975
48.016
+0.072
0.15%
jan 1, 1976
48.703
+0.687
1.43%
jan 1, 1977
49.154
+0.451
0.93%
jan 1, 1978
49.487
+0.333
0.68%
jan 1, 1979
49.778
+0.291
0.59%
jan 1, 1980
49.975
+0.197
0.39%
jan 1, 1981
50.502
+0.527
1.05%
jan 1, 1982
51.562
+1.06
2.1%
jan 1, 1983
51.503
-0.059
-0.11%
jan 1, 1984
51.883
+0.38
0.74%
jan 1, 1985
52.087
+0.204
0.39%
jan 1, 1987
51.499
-0.589
-1.13%
jan 1, 1990
52.347
+0.848
1.65%
jan 1, 1992
50.973
-1.373
-2.62%
jan 1, 1993
51.806
+0.832
1.63%
jan 1, 1994
51.613
-0.193
-0.37%
jan 1, 1995
51.277
-0.336
-0.65%
jan 1, 1996
52.086
+0.809
1.58%
jan 1, 1997
52.872
+0.786
1.51%
jan 1, 1999
51.512
-1.36
-2.57%
jan 1, 2000
51.384
-0.127
-0.25%
jan 1, 2001
50.676
-0.708
-1.38%
jan 1, 2002
50.438
-0.238
-0.47%
jan 1, 2003
49.958
-0.48
-0.95%
jan 1, 2004
49.89
-0.068
-0.14%
jan 1, 2005
49.635
-0.255
-0.51%
jan 1, 2006
49.425
-0.209
-0.42%
jan 1, 2007
49.584
+0.159
0.32%
jan 1, 2008
49.682
+0.098
0.2%
jan 1, 2009
49.517
-0.165
-0.33%
jan 1, 2010
49.332
-0.185
-0.37%
jan 1, 2011
49.241
-0.09
-0.18%
jan 1, 2012
48.58
-0.661
-1.34%
jan 1, 2013
48.329
-0.251
-0.52%
jan 1, 2014
48.847
+0.518
1.07%
jan 1, 2015
48.648
-0.199
-0.41%
Ranking of countries by current statistics by years


Comments: