29
/
en
AIzaSyAYiBZKx7MnpbEhh9jyipgxe19OcubqV5w
April 1, 2024
269816
Turkey
TUR
true
2
1
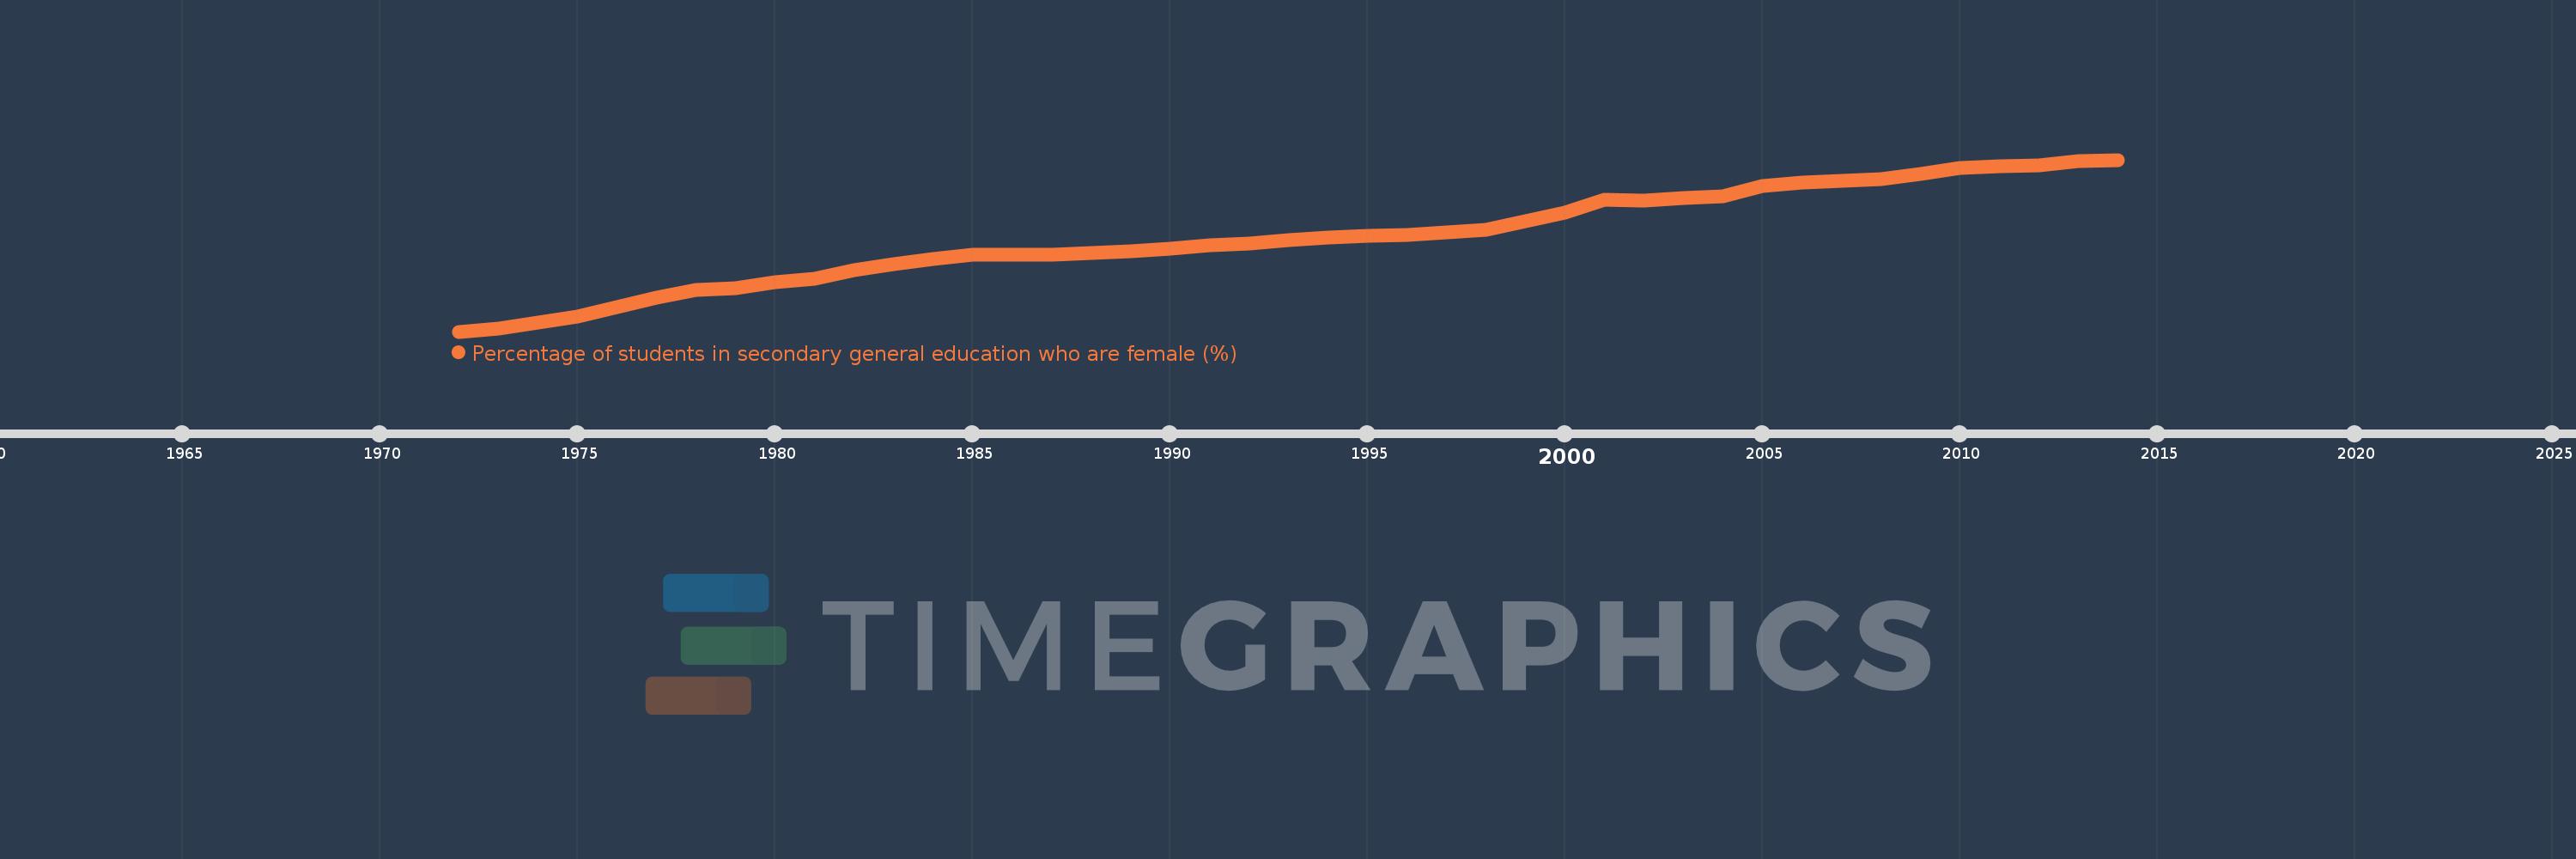
Percentage of students in secondary general education who are female (%)
2014,2013,2012,2011,2010,2009,2008,2007,2006,2005,2004,2003,2002,2001,2000,1998,1996,1995,1994,1993,1992,1991,1990,1989,1988,1987,1985,1984,1983,1982,1981,1980,1979,1978,1977,1975,1974,1973,1972
This statistics in other country:
AfghanistanAlbaniaAlgeriaAndorraAngolaAntigua and BarbudaArab WorldArgentinaArmeniaArubaAustraliaAustriaAzerbaijanBahamas, TheBahrainBangladeshBarbadosBelarusBelgiumBelizeBeninBermudaBhutanBoliviaBosnia and HerzegovinaBotswanaBrazilBritish Virgin IslandsBrunei DarussalamBulgariaBurkina FasoBurundiCabo VerdeCambodiaCameroonCanadaCaribbean small statesCayman IslandsCentral African RepublicCentral Europe and the BalticsChadChileChinaColombiaComorosCongo, Dem. Rep.Congo, Rep.Costa RicaCote d'IvoireCroatiaCubaCuracaoCyprusCzech RepublicDenmarkDjiboutiDominicaDominican RepublicEarly-demographic dividendEast Asia & PacificEast Asia & Pacific (excluding high income)East Asia & Pacific (IDA & IBRD countries)EcuadorEgypt, Arab Rep.El SalvadorEquatorial GuineaEritreaEstoniaEthiopiaEuro areaEurope & Central AsiaEurope & Central Asia (excluding high income)Europe & Central Asia (IDA & IBRD countries)European UnionFijiFinlandFragile and conflict affected situationsFranceGabonGambia, TheGeorgiaGermanyGhanaGibraltarGreeceGrenadaGuatemalaGuineaGuinea-BissauGuyanaHaitiHeavily indebted poor countries (HIPC)High incomeHondurasHong Kong SAR, ChinaHungaryIBRD onlyIcelandIDA & IBRD totalIDA blendIDA onlyIDA totalIndiaIndonesiaIran, Islamic Rep.IraqIrelandIsraelItalyJamaicaJapanJordanKazakhstanKenyaKiribatiKorea, Dem. People’s Rep.Korea, Rep.KuwaitKyrgyz RepublicLao PDRLate-demographic dividendLatin America & Caribbean Latin America & Caribbean (excluding high income)Latin America & the Caribbean (IDA & IBRD countries)LatviaLeast developed countries: UN classificationLebanonLesothoLiberiaLibyaLiechtensteinLithuaniaLow & middle incomeLow incomeLower middle incomeLuxembourgMacao SAR, ChinaMacedonia, FYRMadagascarMalawiMalaysiaMaldivesMaliMaltaMarshall IslandsMauritaniaMauritiusMexicoMicronesia, Fed. Sts.Middle East & North AfricaMiddle East & North Africa (excluding high income)Middle East & North Africa (IDA & IBRD countries)Middle incomeMoldovaMonacoMongoliaMontenegroMoroccoMozambiqueMyanmarNamibiaNauruNepalNetherlandsNew ZealandNicaraguaNigerNigeriaNorth AmericaNorwayOECD membersOmanOther small statesPacific island small statesPakistanPalauPanamaPapua New GuineaParaguayPeruPhilippinesPolandPortugalPost-demographic dividendPre-demographic dividendPuerto RicoQatarRomaniaRussian FederationRwandaSamoaSan MarinoSao Tome and PrincipeSaudi ArabiaSenegalSerbiaSeychellesSierra LeoneSingaporeSint Maarten (Dutch part)Slovak RepublicSloveniaSmall statesSolomon IslandsSomaliaSouth AfricaSouth AsiaSouth Asia (IDA & IBRD)South SudanSpainSri LankaSt. Kitts and NevisSt. LuciaSt. Vincent and the GrenadinesSub-Saharan Africa Sub-Saharan Africa (excluding high income)Sub-Saharan Africa (IDA & IBRD countries)SudanSurinameSwazilandSwedenSwitzerlandSyrian Arab RepublicTajikistanTanzaniaThailandTimor-LesteTogoTongaTrinidad and TobagoTunisiaTurkeyTurkmenistanTurks and Caicos IslandsTuvaluUgandaUkraineUnited Arab EmiratesUnited KingdomUnited StatesUpper middle incomeUruguayUzbekistanVanuatuVenezuela, RBVietnamWest Bank and GazaWorldYemen, Rep.ZambiaZimbabwe Timeline:
This timeline shows a graph from 1972 to 2014 of Turkey. No data until 1971. Number of actual observations by date: 39.
Source name:
World Development Indicators
Source organization:
UNESCO Institute for Statistics
Categories, topics:
Education, Gender
Last updated:
apr 23, 2017
Indicators value changes by year
Minimum:
27.272
jan 1, 1972
Maximum:
49.144
jan 1, 2014
At the date of observation
Value
Absolute change
Change from previous value
jan 1, 1972
27.272
+27.272
0.0%
jan 1, 1973
27.624
+0.352
1.29%
jan 1, 1974
28.447
+0.822
2.98%
jan 1, 1975
29.205
+0.758
2.67%
jan 1, 1977
31.608
+2.404
8.23%
jan 1, 1978
32.524
+0.916
2.9%
jan 1, 1979
32.767
+0.243
0.75%
jan 1, 1980
33.552
+0.785
2.4%
jan 1, 1981
34.034
+0.482
1.44%
jan 1, 1982
35.081
+1.047
3.08%
jan 1, 1983
35.846
+0.765
2.18%
jan 1, 1984
36.565
+0.719
2.01%
jan 1, 1985
37.06
+0.495
1.35%
jan 1, 1987
37.112
+0.052
0.14%
jan 1, 1988
37.29
+0.178
0.48%
jan 1, 1989
37.52
+0.231
0.62%
jan 1, 1990
37.787
+0.267
0.71%
jan 1, 1991
38.241
+0.454
1.2%
jan 1, 1992
38.499
+0.258
0.68%
jan 1, 1993
38.944
+0.445
1.15%
jan 1, 1994
39.234
+0.29
0.75%
jan 1, 1995
39.433
+0.198
0.51%
jan 1, 1996
39.571
+0.138
0.35%
jan 1, 1998
40.203
+0.632
1.6%
jan 1, 2000
42.38
+2.177
5.42%
jan 1, 2001
44.043
+1.663
3.92%
jan 1, 2002
43.943
-0.1
-0.23%
jan 1, 2003
44.286
+0.343
0.78%
jan 1, 2004
44.472
+0.185
0.42%
jan 1, 2005
45.847
+1.375
3.09%
jan 1, 2006
46.204
+0.357
0.78%
jan 1, 2007
46.477
+0.273
0.59%
jan 1, 2008
46.699
+0.222
0.48%
jan 1, 2009
47.302
+0.603
1.29%
jan 1, 2010
48.126
+0.824
1.74%
jan 1, 2011
48.349
+0.223
0.46%
jan 1, 2012
48.466
+0.117
0.24%
jan 1, 2013
48.971
+0.505
1.04%
jan 1, 2014
49.144
+0.173
0.35%
Ranking of countries by current statistics by years


Comments: