29
/
en
AIzaSyAYiBZKx7MnpbEhh9jyipgxe19OcubqV5w
April 1, 2024
196030
Mexico
MEX
true
2
1
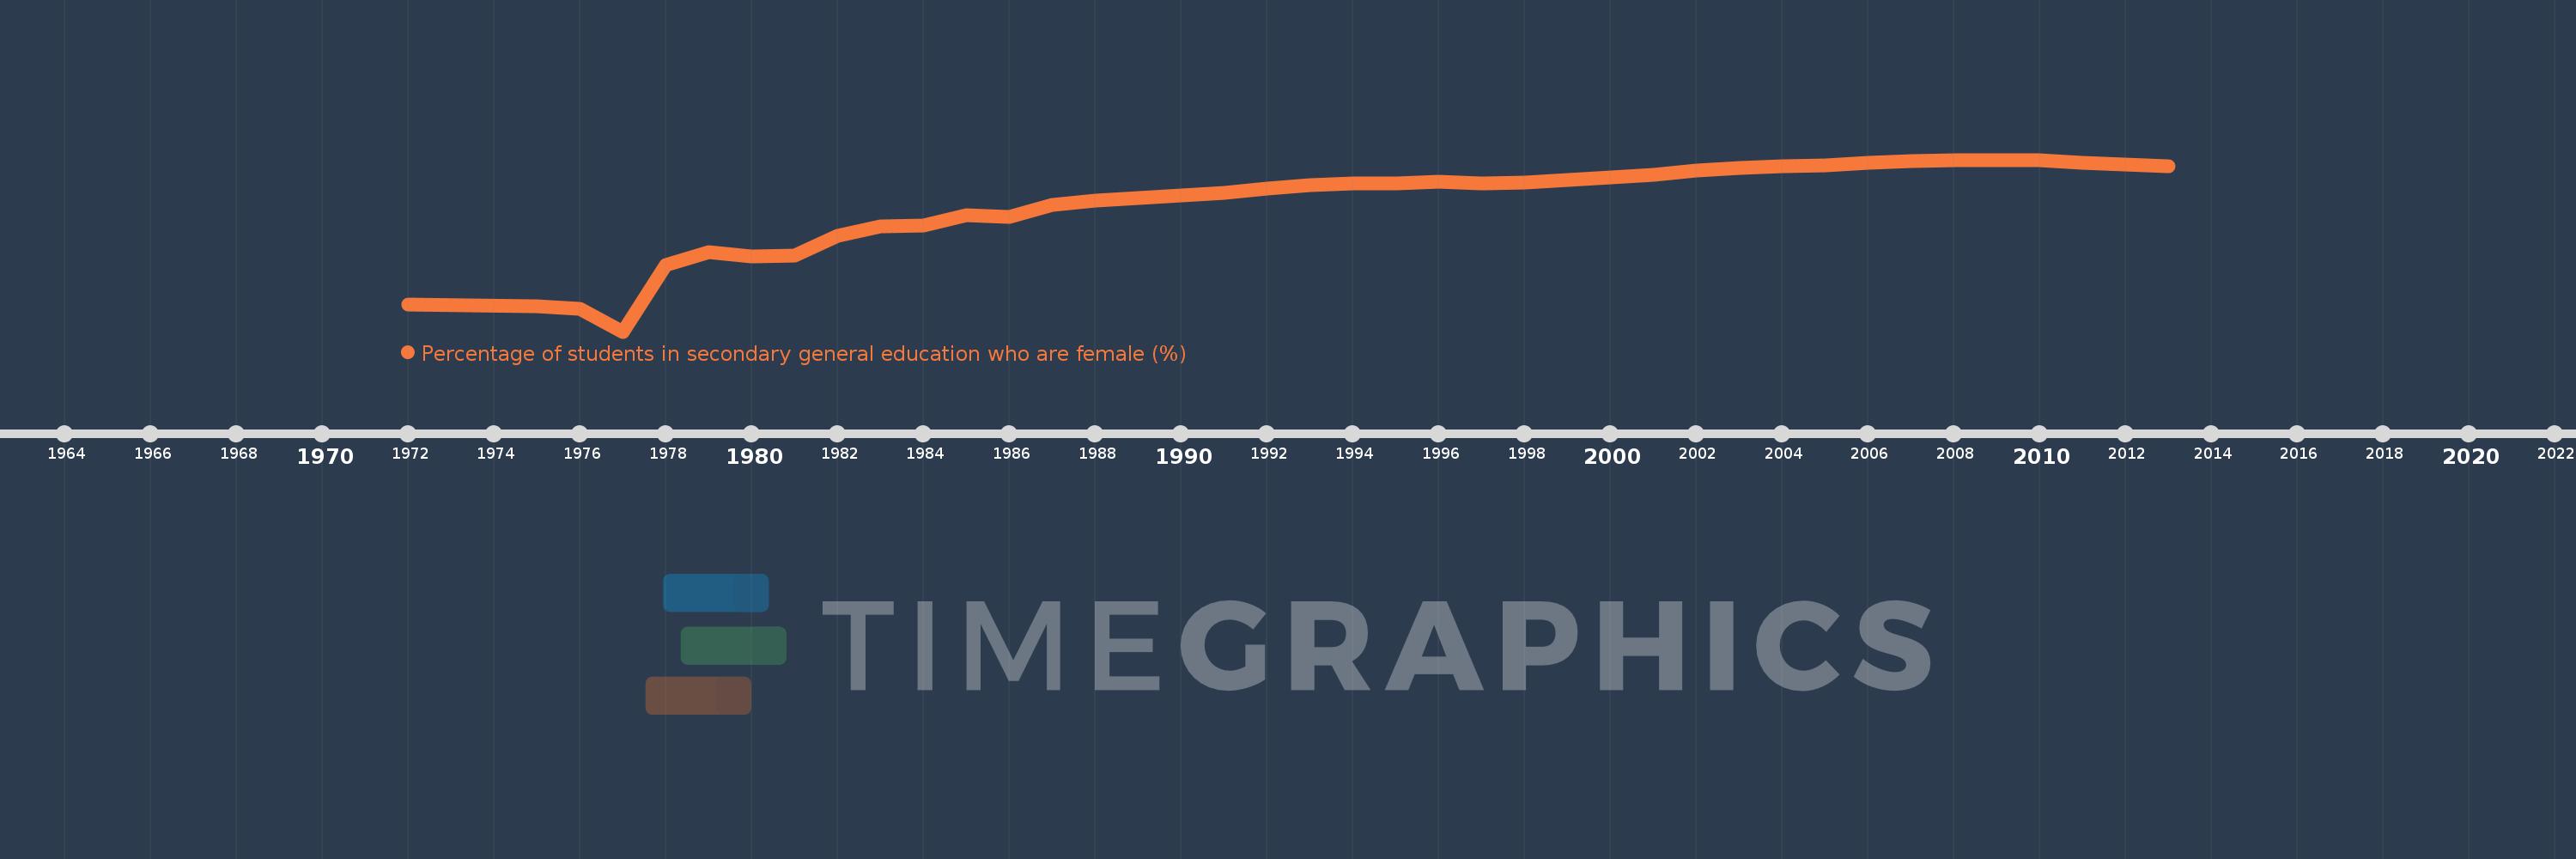
Percentage of students in secondary general education who are female (%)
2013,2012,2011,2010,2009,2008,2007,2006,2005,2004,2003,2002,2001,2000,1999,1998,1997,1996,1995,1994,1993,1992,1991,1990,1989,1988,1987,1986,1985,1984,1983,1982,1981,1980,1979,1978,1977,1976,1975,1972
This statistics in other country:
AfghanistanAlbaniaAlgeriaAndorraAngolaAntigua and BarbudaArab WorldArgentinaArmeniaArubaAustraliaAustriaAzerbaijanBahamas, TheBahrainBangladeshBarbadosBelarusBelgiumBelizeBeninBermudaBhutanBoliviaBosnia and HerzegovinaBotswanaBrazilBritish Virgin IslandsBrunei DarussalamBulgariaBurkina FasoBurundiCabo VerdeCambodiaCameroonCanadaCaribbean small statesCayman IslandsCentral African RepublicCentral Europe and the BalticsChadChileChinaColombiaComorosCongo, Dem. Rep.Congo, Rep.Costa RicaCote d'IvoireCroatiaCubaCuracaoCyprusCzech RepublicDenmarkDjiboutiDominicaDominican RepublicEarly-demographic dividendEast Asia & PacificEast Asia & Pacific (excluding high income)East Asia & Pacific (IDA & IBRD countries)EcuadorEgypt, Arab Rep.El SalvadorEquatorial GuineaEritreaEstoniaEthiopiaEuro areaEurope & Central AsiaEurope & Central Asia (excluding high income)Europe & Central Asia (IDA & IBRD countries)European UnionFijiFinlandFragile and conflict affected situationsFranceGabonGambia, TheGeorgiaGermanyGhanaGibraltarGreeceGrenadaGuatemalaGuineaGuinea-BissauGuyanaHaitiHeavily indebted poor countries (HIPC)High incomeHondurasHong Kong SAR, ChinaHungaryIBRD onlyIcelandIDA & IBRD totalIDA blendIDA onlyIDA totalIndiaIndonesiaIran, Islamic Rep.IraqIrelandIsraelItalyJamaicaJapanJordanKazakhstanKenyaKiribatiKorea, Dem. People’s Rep.Korea, Rep.KuwaitKyrgyz RepublicLao PDRLate-demographic dividendLatin America & Caribbean Latin America & Caribbean (excluding high income)Latin America & the Caribbean (IDA & IBRD countries)LatviaLeast developed countries: UN classificationLebanonLesothoLiberiaLibyaLiechtensteinLithuaniaLow & middle incomeLow incomeLower middle incomeLuxembourgMacao SAR, ChinaMacedonia, FYRMadagascarMalawiMalaysiaMaldivesMaliMaltaMarshall IslandsMauritaniaMauritiusMexicoMicronesia, Fed. Sts.Middle East & North AfricaMiddle East & North Africa (excluding high income)Middle East & North Africa (IDA & IBRD countries)Middle incomeMoldovaMonacoMongoliaMontenegroMoroccoMozambiqueMyanmarNamibiaNauruNepalNetherlandsNew ZealandNicaraguaNigerNigeriaNorth AmericaNorwayOECD membersOmanOther small statesPacific island small statesPakistanPalauPanamaPapua New GuineaParaguayPeruPhilippinesPolandPortugalPost-demographic dividendPre-demographic dividendPuerto RicoQatarRomaniaRussian FederationRwandaSamoaSan MarinoSao Tome and PrincipeSaudi ArabiaSenegalSerbiaSeychellesSierra LeoneSingaporeSint Maarten (Dutch part)Slovak RepublicSloveniaSmall statesSolomon IslandsSomaliaSouth AfricaSouth AsiaSouth Asia (IDA & IBRD)South SudanSpainSri LankaSt. Kitts and NevisSt. LuciaSt. Vincent and the GrenadinesSub-Saharan Africa Sub-Saharan Africa (excluding high income)Sub-Saharan Africa (IDA & IBRD countries)SudanSurinameSwazilandSwedenSwitzerlandSyrian Arab RepublicTajikistanTanzaniaThailandTimor-LesteTogoTongaTrinidad and TobagoTunisiaTurkeyTurkmenistanTurks and Caicos IslandsTuvaluUgandaUkraineUnited Arab EmiratesUnited KingdomUnited StatesUpper middle incomeUruguayUzbekistanVanuatuVenezuela, RBVietnamWest Bank and GazaWorldYemen, Rep.ZambiaZimbabwe Timeline:
This timeline shows a graph from 1972 to 2013 of Mexico. No data until 1971. Number of actual observations by date: 40.
Source name:
World Development Indicators
Source organization:
UNESCO Institute for Statistics
Categories, topics:
Education, Gender
Last updated:
apr 23, 2017
Indicators value changes by year
Minimum:
34.061
jan 1, 1977
Maximum:
50.619
jan 1, 2009
At the date of observation
Value
Absolute change
Change from previous value
jan 1, 1972
36.708
+36.708
0.0%
jan 1, 1975
36.485
-0.224
-0.61%
jan 1, 1976
36.257
-0.227
-0.62%
jan 1, 1977
34.061
-2.196
-6.06%
jan 1, 1978
40.441
+6.379
18.73%
jan 1, 1979
41.732
+1.292
3.19%
jan 1, 1980
41.266
-0.466
-1.12%
jan 1, 1981
41.4
+0.133
0.32%
jan 1, 1982
43.315
+1.915
4.63%
jan 1, 1983
44.181
+0.866
2.0%
jan 1, 1984
44.252
+0.071
0.16%
jan 1, 1985
45.261
+1.009
2.28%
jan 1, 1986
45.137
-0.124
-0.27%
jan 1, 1987
46.272
+1.134
2.51%
jan 1, 1988
46.686
+0.414
0.89%
jan 1, 1989
46.942
+0.256
0.55%
jan 1, 1990
47.194
+0.252
0.54%
jan 1, 1991
47.467
+0.273
0.58%
jan 1, 1992
47.827
+0.359
0.76%
jan 1, 1993
48.171
+0.344
0.72%
jan 1, 1994
48.316
+0.145
0.3%
jan 1, 1995
48.365
+0.049
0.1%
jan 1, 1996
48.54
+0.175
0.36%
jan 1, 1997
48.383
-0.157
-0.32%
jan 1, 1998
48.463
+0.081
0.17%
jan 1, 1999
48.657
+0.194
0.4%
jan 1, 2000
48.961
+0.304
0.62%
jan 1, 2001
49.182
+0.221
0.45%
jan 1, 2002
49.545
+0.363
0.74%
jan 1, 2003
49.805
+0.26
0.52%
jan 1, 2004
50.011
+0.205
0.41%
jan 1, 2005
50.106
+0.095
0.19%
jan 1, 2006
50.292
+0.186
0.37%
jan 1, 2007
50.454
+0.161
0.32%
jan 1, 2008
50.552
+0.098
0.19%
jan 1, 2009
50.619
+0.067
0.13%
jan 1, 2010
50.566
-0.053
-0.1%
jan 1, 2011
50.338
-0.228
-0.45%
jan 1, 2012
50.195
-0.143
-0.29%
jan 1, 2013
49.967
-0.228
-0.45%
Ranking of countries by current statistics by years


Comments: