29
/
en
AIzaSyAYiBZKx7MnpbEhh9jyipgxe19OcubqV5w
April 1, 2024
47508
Lower middle income
LMC
false
2
1
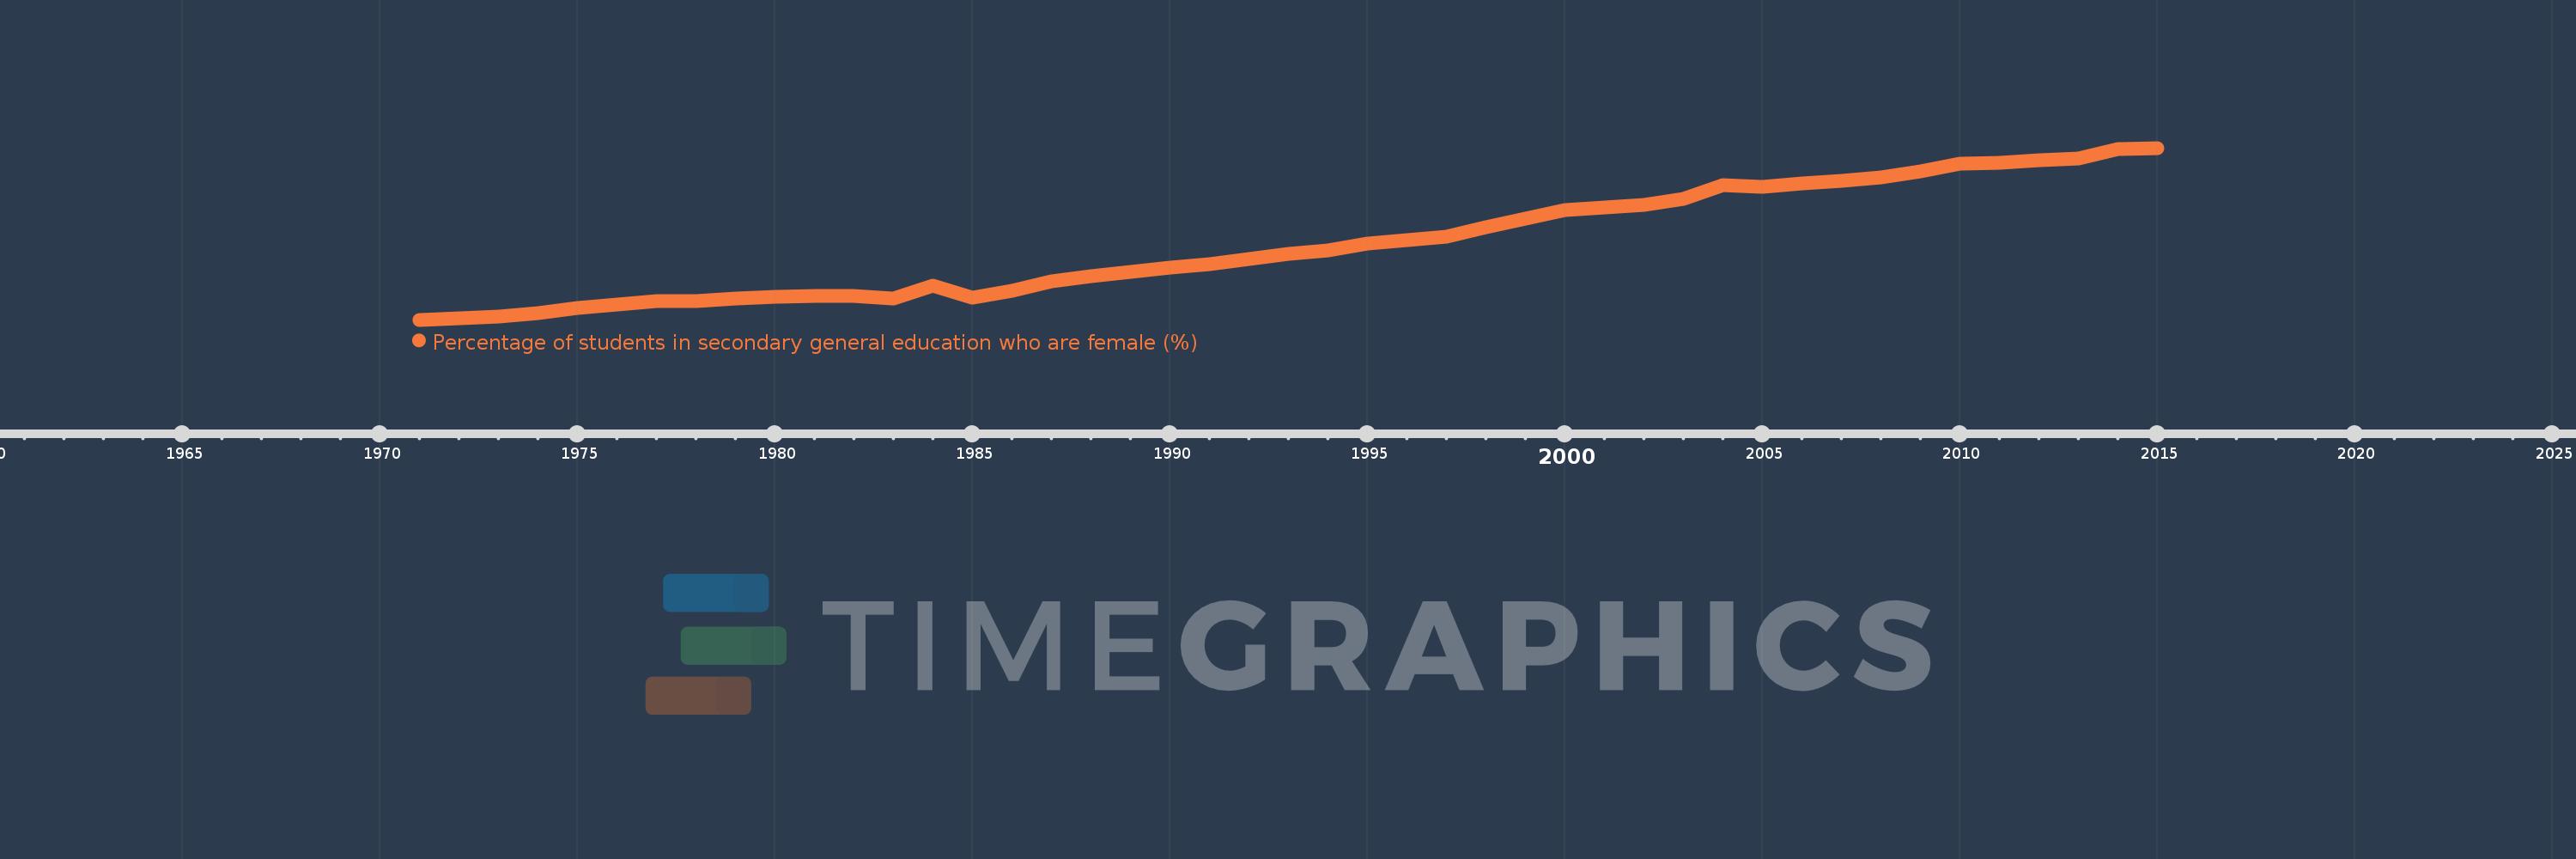
Percentage of students in secondary general education who are female (%)
2015,2014,2013,2012,2011,2010,2009,2008,2007,2006,2005,2004,2003,2002,2001,2000,1999,1998,1997,1996,1995,1994,1993,1992,1991,1990,1989,1988,1987,1986,1985,1984,1983,1982,1981,1980,1979,1978,1977,1976,1975,1974,1973,1972,1971
This statistics in other country:
AfghanistanAlbaniaAlgeriaAndorraAngolaAntigua and BarbudaArab WorldArgentinaArmeniaArubaAustraliaAustriaAzerbaijanBahamas, TheBahrainBangladeshBarbadosBelarusBelgiumBelizeBeninBermudaBhutanBoliviaBosnia and HerzegovinaBotswanaBrazilBritish Virgin IslandsBrunei DarussalamBulgariaBurkina FasoBurundiCabo VerdeCambodiaCameroonCanadaCaribbean small statesCayman IslandsCentral African RepublicCentral Europe and the BalticsChadChileChinaColombiaComorosCongo, Dem. Rep.Congo, Rep.Costa RicaCote d'IvoireCroatiaCubaCuracaoCyprusCzech RepublicDenmarkDjiboutiDominicaDominican RepublicEarly-demographic dividendEast Asia & PacificEast Asia & Pacific (excluding high income)East Asia & Pacific (IDA & IBRD countries)EcuadorEgypt, Arab Rep.El SalvadorEquatorial GuineaEritreaEstoniaEthiopiaEuro areaEurope & Central AsiaEurope & Central Asia (excluding high income)Europe & Central Asia (IDA & IBRD countries)European UnionFijiFinlandFragile and conflict affected situationsFranceGabonGambia, TheGeorgiaGermanyGhanaGibraltarGreeceGrenadaGuatemalaGuineaGuinea-BissauGuyanaHaitiHeavily indebted poor countries (HIPC)High incomeHondurasHong Kong SAR, ChinaHungaryIBRD onlyIcelandIDA & IBRD totalIDA blendIDA onlyIDA totalIndiaIndonesiaIran, Islamic Rep.IraqIrelandIsraelItalyJamaicaJapanJordanKazakhstanKenyaKiribatiKorea, Dem. People’s Rep.Korea, Rep.KuwaitKyrgyz RepublicLao PDRLate-demographic dividendLatin America & Caribbean Latin America & Caribbean (excluding high income)Latin America & the Caribbean (IDA & IBRD countries)LatviaLeast developed countries: UN classificationLebanonLesothoLiberiaLibyaLiechtensteinLithuaniaLow & middle incomeLow incomeLower middle incomeLuxembourgMacao SAR, ChinaMacedonia, FYRMadagascarMalawiMalaysiaMaldivesMaliMaltaMarshall IslandsMauritaniaMauritiusMexicoMicronesia, Fed. Sts.Middle East & North AfricaMiddle East & North Africa (excluding high income)Middle East & North Africa (IDA & IBRD countries)Middle incomeMoldovaMonacoMongoliaMontenegroMoroccoMozambiqueMyanmarNamibiaNauruNepalNetherlandsNew ZealandNicaraguaNigerNigeriaNorth AmericaNorwayOECD membersOmanOther small statesPacific island small statesPakistanPalauPanamaPapua New GuineaParaguayPeruPhilippinesPolandPortugalPost-demographic dividendPre-demographic dividendPuerto RicoQatarRomaniaRussian FederationRwandaSamoaSan MarinoSao Tome and PrincipeSaudi ArabiaSenegalSerbiaSeychellesSierra LeoneSingaporeSint Maarten (Dutch part)Slovak RepublicSloveniaSmall statesSolomon IslandsSomaliaSouth AfricaSouth AsiaSouth Asia (IDA & IBRD)South SudanSpainSri LankaSt. Kitts and NevisSt. LuciaSt. Vincent and the GrenadinesSub-Saharan Africa Sub-Saharan Africa (excluding high income)Sub-Saharan Africa (IDA & IBRD countries)SudanSurinameSwazilandSwedenSwitzerlandSyrian Arab RepublicTajikistanTanzaniaThailandTimor-LesteTogoTongaTrinidad and TobagoTunisiaTurkeyTurkmenistanTurks and Caicos IslandsTuvaluUgandaUkraineUnited Arab EmiratesUnited KingdomUnited StatesUpper middle incomeUruguayUzbekistanVanuatuVenezuela, RBVietnamWest Bank and GazaWorldYemen, Rep.ZambiaZimbabwe Timeline:
This timeline shows a graph from 1971 to 2015 of Lower middle income. No data until 1970. Number of actual observations by date: 45.
Source name:
World Development Indicators
Source organization:
UNESCO Institute for Statistics
Categories, topics:
Education, Gender
Last updated:
apr 23, 2017
Indicators value changes by year
Minimum:
35.775
jan 1, 1971
At the date of observation
Value
Absolute change
Change from previous value
jan 1, 1971
35.775
+35.775
0.0%
jan 1, 1972
35.865
+0.09
0.25%
jan 1, 1973
36.006
+0.14
0.39%
jan 1, 1974
36.273
+0.267
0.74%
jan 1, 1975
36.604
+0.331
0.91%
jan 1, 1976
36.888
+0.284
0.78%
jan 1, 1977
37.116
+0.229
0.62%
jan 1, 1978
37.127
+0.011
0.03%
jan 1, 1979
37.326
+0.199
0.54%
jan 1, 1980
37.425
+0.099
0.26%
jan 1, 1981
37.459
+0.034
0.09%
jan 1, 1982
37.471
+0.012
0.03%
jan 1, 1983
37.289
-0.182
-0.49%
jan 1, 1984
38.239
+0.95
2.55%
jan 1, 1985
37.343
-0.895
-2.34%
jan 1, 1986
37.878
+0.535
1.43%
jan 1, 1987
38.548
+0.669
1.77%
jan 1, 1988
38.908
+0.36
0.93%
jan 1, 1989
39.199
+0.291
0.75%
jan 1, 1990
39.507
+0.308
0.79%
jan 1, 1991
39.765
+0.258
0.65%
jan 1, 1992
40.141
+0.376
0.95%
jan 1, 1993
40.484
+0.342
0.85%
jan 1, 1994
40.748
+0.264
0.65%
jan 1, 1995
41.27
+0.522
1.28%
jan 1, 1996
41.491
+0.221
0.53%
jan 1, 1997
41.771
+0.28
0.67%
jan 1, 1998
42.428
+0.658
1.57%
jan 1, 1999
43.055
+0.627
1.48%
jan 1, 2000
43.663
+0.607
1.41%
jan 1, 2001
43.858
+0.196
0.45%
jan 1, 2002
44.048
+0.189
0.43%
jan 1, 2003
44.467
+0.42
0.95%
jan 1, 2004
45.459
+0.991
2.23%
jan 1, 2005
45.321
-0.138
-0.3%
jan 1, 2006
45.557
+0.236
0.52%
jan 1, 2007
45.748
+0.192
0.42%
jan 1, 2008
46.004
+0.256
0.56%
jan 1, 2009
46.409
+0.404
0.88%
jan 1, 2010
46.966
+0.557
1.2%
jan 1, 2011
47.065
+0.1
0.21%
jan 1, 2012
47.253
+0.187
0.4%
jan 1, 2013
47.375
+0.122
0.26%
jan 1, 2014
48.019
+0.644
1.36%
jan 1, 2015
48.12
+0.101
0.21%
Ranking of countries by current statistics by years


Comments: