29
/
en
AIzaSyAYiBZKx7MnpbEhh9jyipgxe19OcubqV5w
April 1, 2024
24418
Arab World
ARB
false
2
1
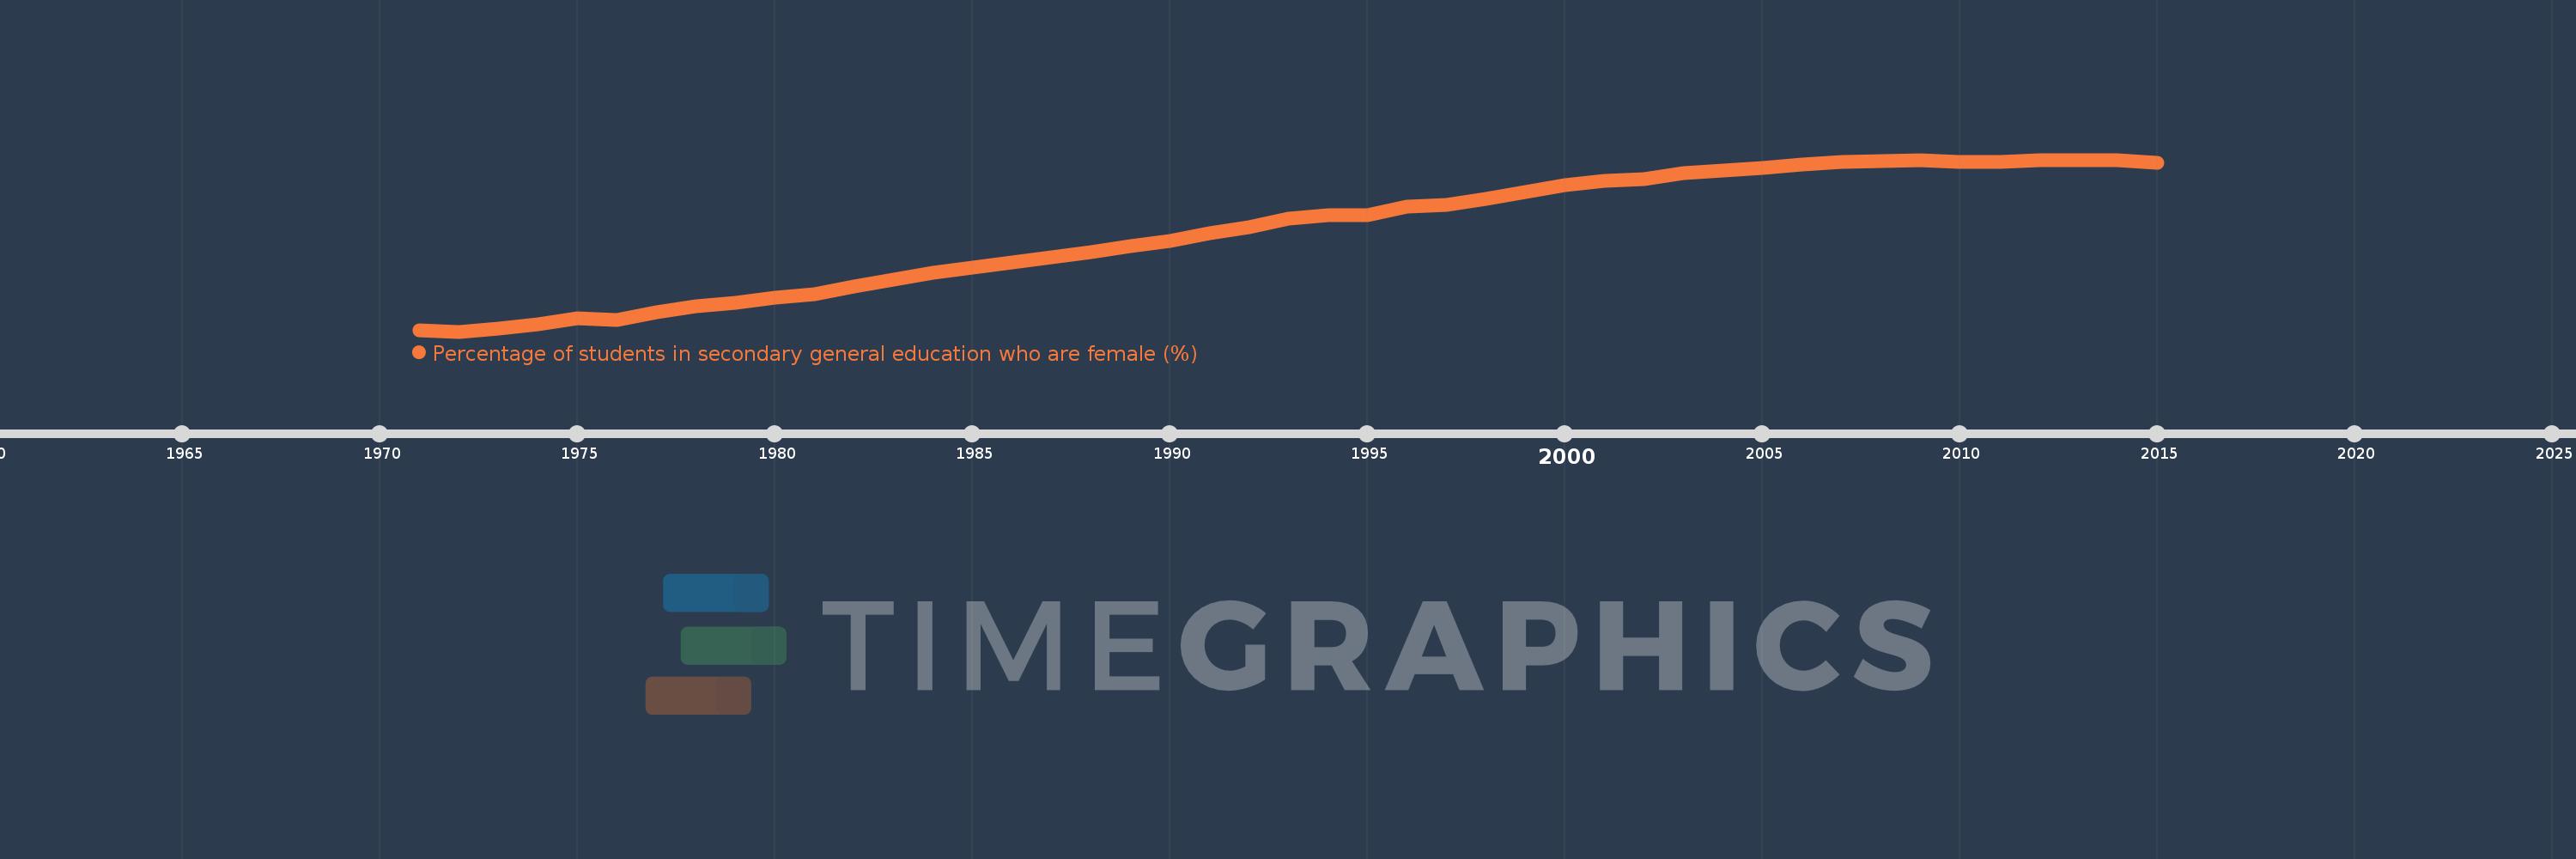
Percentage of students in secondary general education who are female (%)
2015,2014,2013,2012,2011,2010,2009,2008,2007,2006,2005,2004,2003,2002,2001,2000,1999,1998,1997,1996,1995,1994,1993,1992,1991,1990,1989,1988,1987,1986,1985,1984,1983,1982,1981,1980,1979,1978,1977,1976,1975,1974,1973,1972,1971
This statistics in other country:
AfghanistanAlbaniaAlgeriaAndorraAngolaAntigua and BarbudaArab WorldArgentinaArmeniaArubaAustraliaAustriaAzerbaijanBahamas, TheBahrainBangladeshBarbadosBelarusBelgiumBelizeBeninBermudaBhutanBoliviaBosnia and HerzegovinaBotswanaBrazilBritish Virgin IslandsBrunei DarussalamBulgariaBurkina FasoBurundiCabo VerdeCambodiaCameroonCanadaCaribbean small statesCayman IslandsCentral African RepublicCentral Europe and the BalticsChadChileChinaColombiaComorosCongo, Dem. Rep.Congo, Rep.Costa RicaCote d'IvoireCroatiaCubaCuracaoCyprusCzech RepublicDenmarkDjiboutiDominicaDominican RepublicEarly-demographic dividendEast Asia & PacificEast Asia & Pacific (excluding high income)East Asia & Pacific (IDA & IBRD countries)EcuadorEgypt, Arab Rep.El SalvadorEquatorial GuineaEritreaEstoniaEthiopiaEuro areaEurope & Central AsiaEurope & Central Asia (excluding high income)Europe & Central Asia (IDA & IBRD countries)European UnionFijiFinlandFragile and conflict affected situationsFranceGabonGambia, TheGeorgiaGermanyGhanaGibraltarGreeceGrenadaGuatemalaGuineaGuinea-BissauGuyanaHaitiHeavily indebted poor countries (HIPC)High incomeHondurasHong Kong SAR, ChinaHungaryIBRD onlyIcelandIDA & IBRD totalIDA blendIDA onlyIDA totalIndiaIndonesiaIran, Islamic Rep.IraqIrelandIsraelItalyJamaicaJapanJordanKazakhstanKenyaKiribatiKorea, Dem. People’s Rep.Korea, Rep.KuwaitKyrgyz RepublicLao PDRLate-demographic dividendLatin America & Caribbean Latin America & Caribbean (excluding high income)Latin America & the Caribbean (IDA & IBRD countries)LatviaLeast developed countries: UN classificationLebanonLesothoLiberiaLibyaLiechtensteinLithuaniaLow & middle incomeLow incomeLower middle incomeLuxembourgMacao SAR, ChinaMacedonia, FYRMadagascarMalawiMalaysiaMaldivesMaliMaltaMarshall IslandsMauritaniaMauritiusMexicoMicronesia, Fed. Sts.Middle East & North AfricaMiddle East & North Africa (excluding high income)Middle East & North Africa (IDA & IBRD countries)Middle incomeMoldovaMonacoMongoliaMontenegroMoroccoMozambiqueMyanmarNamibiaNauruNepalNetherlandsNew ZealandNicaraguaNigerNigeriaNorth AmericaNorwayOECD membersOmanOther small statesPacific island small statesPakistanPalauPanamaPapua New GuineaParaguayPeruPhilippinesPolandPortugalPost-demographic dividendPre-demographic dividendPuerto RicoQatarRomaniaRussian FederationRwandaSamoaSan MarinoSao Tome and PrincipeSaudi ArabiaSenegalSerbiaSeychellesSierra LeoneSingaporeSint Maarten (Dutch part)Slovak RepublicSloveniaSmall statesSolomon IslandsSomaliaSouth AfricaSouth AsiaSouth Asia (IDA & IBRD)South SudanSpainSri LankaSt. Kitts and NevisSt. LuciaSt. Vincent and the GrenadinesSub-Saharan Africa Sub-Saharan Africa (excluding high income)Sub-Saharan Africa (IDA & IBRD countries)SudanSurinameSwazilandSwedenSwitzerlandSyrian Arab RepublicTajikistanTanzaniaThailandTimor-LesteTogoTongaTrinidad and TobagoTunisiaTurkeyTurkmenistanTurks and Caicos IslandsTuvaluUgandaUkraineUnited Arab EmiratesUnited KingdomUnited StatesUpper middle incomeUruguayUzbekistanVanuatuVenezuela, RBVietnamWest Bank and GazaWorldYemen, Rep.ZambiaZimbabwe Timeline:
This timeline shows a graph from 1971 to 2015 of Arab World. No data until 1970. Number of actual observations by date: 45.
Source name:
World Development Indicators
Source organization:
UNESCO Institute for Statistics
Categories, topics:
Education, Gender
Last updated:
apr 23, 2017
Indicators value changes by year
Minimum:
34.501
jan 1, 1972
Maximum:
48.032
jan 1, 2013
At the date of observation
Value
Absolute change
Change from previous value
jan 1, 1971
34.58
+34.58
0.0%
jan 1, 1972
34.501
-0.08
-0.23%
jan 1, 1973
34.771
+0.27
0.78%
jan 1, 1974
35.095
+0.324
0.93%
jan 1, 1975
35.58
+0.484
1.38%
jan 1, 1976
35.438
-0.142
-0.4%
jan 1, 1977
36.007
+0.569
1.61%
jan 1, 1978
36.465
+0.458
1.27%
jan 1, 1979
36.775
+0.31
0.85%
jan 1, 1980
37.18
+0.405
1.1%
jan 1, 1981
37.419
+0.238
0.64%
jan 1, 1982
38.076
+0.657
1.76%
jan 1, 1983
38.61
+0.535
1.4%
jan 1, 1984
39.156
+0.545
1.41%
jan 1, 1985
39.56
+0.405
1.03%
jan 1, 1986
39.947
+0.387
0.98%
jan 1, 1987
40.353
+0.407
1.02%
jan 1, 1988
40.747
+0.393
0.97%
jan 1, 1989
41.235
+0.488
1.2%
jan 1, 1990
41.622
+0.387
0.94%
jan 1, 1991
42.215
+0.593
1.43%
jan 1, 1992
42.731
+0.516
1.22%
jan 1, 1993
43.396
+0.665
1.56%
jan 1, 1994
43.674
+0.278
0.64%
jan 1, 1995
43.675
+0.001
0.0%
jan 1, 1996
44.339
+0.664
1.52%
jan 1, 1997
44.508
+0.169
0.38%
jan 1, 1998
44.987
+0.479
1.08%
jan 1, 1999
45.496
+0.509
1.13%
jan 1, 2000
46.036
+0.54
1.19%
jan 1, 2001
46.344
+0.309
0.67%
jan 1, 2002
46.521
+0.177
0.38%
jan 1, 2003
46.969
+0.448
0.96%
jan 1, 2004
47.218
+0.249
0.53%
jan 1, 2005
47.403
+0.185
0.39%
jan 1, 2006
47.687
+0.284
0.6%
jan 1, 2007
47.879
+0.192
0.4%
jan 1, 2008
47.943
+0.064
0.13%
jan 1, 2009
47.99
+0.047
0.1%
jan 1, 2010
47.878
-0.111
-0.23%
jan 1, 2011
47.893
+0.015
0.03%
jan 1, 2012
48.026
+0.133
0.28%
jan 1, 2013
48.032
+0.006
0.01%
jan 1, 2014
47.99
-0.041
-0.09%
jan 1, 2015
47.806
-0.184
-0.38%
Ranking of countries by current statistics by years


Comments: