29
/
en
AIzaSyAYiBZKx7MnpbEhh9jyipgxe19OcubqV5w
April 1, 2024
188258
Malaysia
MYS
true
2
1
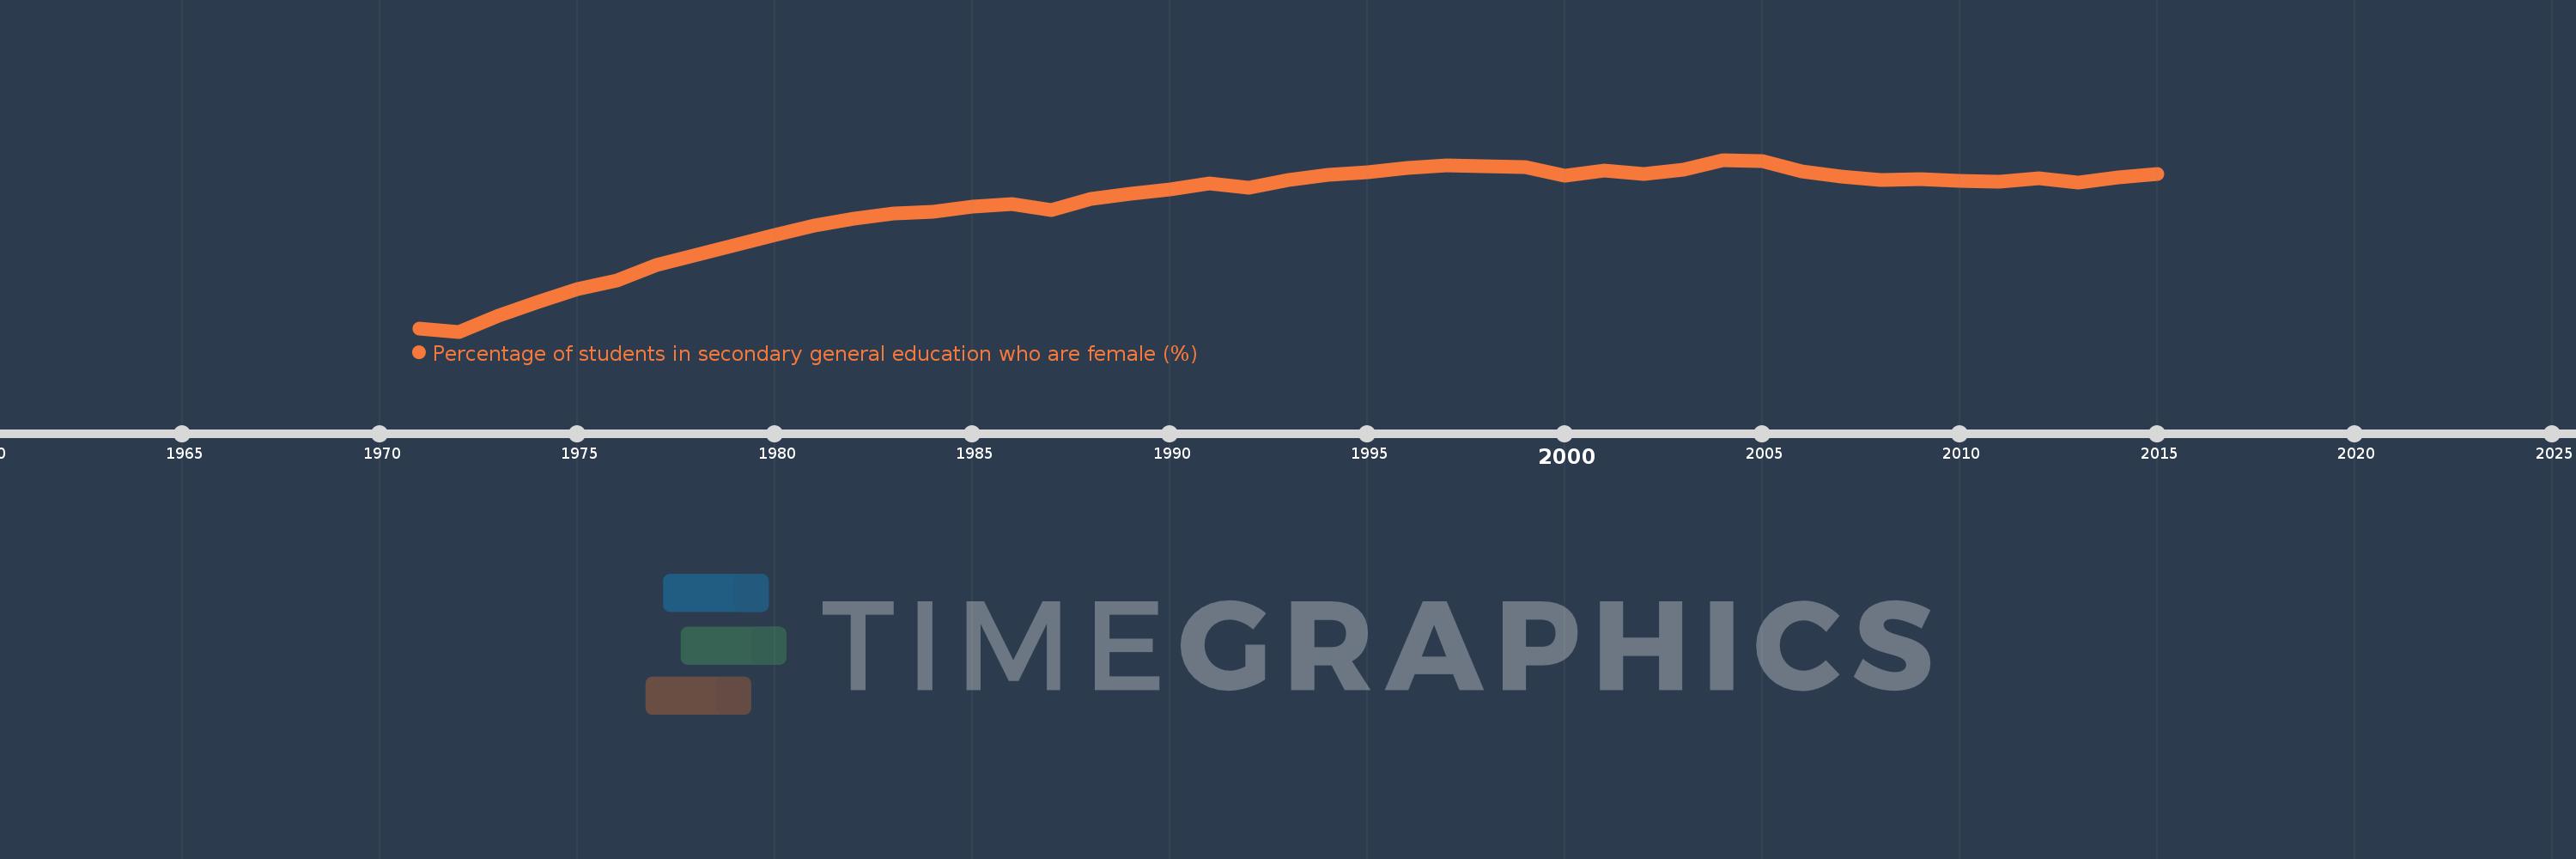
Percentage of students in secondary general education who are female (%)
2015,2014,2013,2012,2011,2010,2009,2008,2007,2006,2005,2004,2003,2002,2001,2000,1999,1997,1996,1995,1994,1993,1992,1991,1990,1989,1988,1987,1986,1985,1984,1983,1982,1981,1980,1977,1976,1975,1974,1973,1972,1971
This statistics in other country:
AfghanistanAlbaniaAlgeriaAndorraAngolaAntigua and BarbudaArab WorldArgentinaArmeniaArubaAustraliaAustriaAzerbaijanBahamas, TheBahrainBangladeshBarbadosBelarusBelgiumBelizeBeninBermudaBhutanBoliviaBosnia and HerzegovinaBotswanaBrazilBritish Virgin IslandsBrunei DarussalamBulgariaBurkina FasoBurundiCabo VerdeCambodiaCameroonCanadaCaribbean small statesCayman IslandsCentral African RepublicCentral Europe and the BalticsChadChileChinaColombiaComorosCongo, Dem. Rep.Congo, Rep.Costa RicaCote d'IvoireCroatiaCubaCuracaoCyprusCzech RepublicDenmarkDjiboutiDominicaDominican RepublicEarly-demographic dividendEast Asia & PacificEast Asia & Pacific (excluding high income)East Asia & Pacific (IDA & IBRD countries)EcuadorEgypt, Arab Rep.El SalvadorEquatorial GuineaEritreaEstoniaEthiopiaEuro areaEurope & Central AsiaEurope & Central Asia (excluding high income)Europe & Central Asia (IDA & IBRD countries)European UnionFijiFinlandFragile and conflict affected situationsFranceGabonGambia, TheGeorgiaGermanyGhanaGibraltarGreeceGrenadaGuatemalaGuineaGuinea-BissauGuyanaHaitiHeavily indebted poor countries (HIPC)High incomeHondurasHong Kong SAR, ChinaHungaryIBRD onlyIcelandIDA & IBRD totalIDA blendIDA onlyIDA totalIndiaIndonesiaIran, Islamic Rep.IraqIrelandIsraelItalyJamaicaJapanJordanKazakhstanKenyaKiribatiKorea, Dem. People’s Rep.Korea, Rep.KuwaitKyrgyz RepublicLao PDRLate-demographic dividendLatin America & Caribbean Latin America & Caribbean (excluding high income)Latin America & the Caribbean (IDA & IBRD countries)LatviaLeast developed countries: UN classificationLebanonLesothoLiberiaLibyaLiechtensteinLithuaniaLow & middle incomeLow incomeLower middle incomeLuxembourgMacao SAR, ChinaMacedonia, FYRMadagascarMalawiMalaysiaMaldivesMaliMaltaMarshall IslandsMauritaniaMauritiusMexicoMicronesia, Fed. Sts.Middle East & North AfricaMiddle East & North Africa (excluding high income)Middle East & North Africa (IDA & IBRD countries)Middle incomeMoldovaMonacoMongoliaMontenegroMoroccoMozambiqueMyanmarNamibiaNauruNepalNetherlandsNew ZealandNicaraguaNigerNigeriaNorth AmericaNorwayOECD membersOmanOther small statesPacific island small statesPakistanPalauPanamaPapua New GuineaParaguayPeruPhilippinesPolandPortugalPost-demographic dividendPre-demographic dividendPuerto RicoQatarRomaniaRussian FederationRwandaSamoaSan MarinoSao Tome and PrincipeSaudi ArabiaSenegalSerbiaSeychellesSierra LeoneSingaporeSint Maarten (Dutch part)Slovak RepublicSloveniaSmall statesSolomon IslandsSomaliaSouth AfricaSouth AsiaSouth Asia (IDA & IBRD)South SudanSpainSri LankaSt. Kitts and NevisSt. LuciaSt. Vincent and the GrenadinesSub-Saharan Africa Sub-Saharan Africa (excluding high income)Sub-Saharan Africa (IDA & IBRD countries)SudanSurinameSwazilandSwedenSwitzerlandSyrian Arab RepublicTajikistanTanzaniaThailandTimor-LesteTogoTongaTrinidad and TobagoTunisiaTurkeyTurkmenistanTurks and Caicos IslandsTuvaluUgandaUkraineUnited Arab EmiratesUnited KingdomUnited StatesUpper middle incomeUruguayUzbekistanVanuatuVenezuela, RBVietnamWest Bank and GazaWorldYemen, Rep.ZambiaZimbabwe Timeline:
This timeline shows a graph from 1971 to 2015 of Malaysia. No data until 1970. Number of actual observations by date: 42.
Source name:
World Development Indicators
Source organization:
UNESCO Institute for Statistics
Categories, topics:
Education, Gender
Last updated:
apr 23, 2017
Indicators value changes by year
Minimum:
40.496
jan 1, 1972
Maximum:
52.546
jan 1, 2004
At the date of observation
Value
Absolute change
Change from previous value
jan 1, 1971
40.736
+40.736
0.0%
jan 1, 1972
40.496
-0.24
-0.59%
jan 1, 1973
41.583
+1.087
2.68%
jan 1, 1974
42.591
+1.008
2.42%
jan 1, 1975
43.5
+0.909
2.13%
jan 1, 1976
44.069
+0.569
1.31%
jan 1, 1977
45.144
+1.075
2.44%
jan 1, 1980
47.29
+2.146
4.75%
jan 1, 1981
47.929
+0.639
1.35%
jan 1, 1982
48.41
+0.482
1.01%
jan 1, 1983
48.803
+0.393
0.81%
jan 1, 1984
48.913
+0.11
0.22%
jan 1, 1985
49.278
+0.365
0.75%
jan 1, 1986
49.439
+0.161
0.33%
jan 1, 1987
49.027
-0.412
-0.83%
jan 1, 1988
49.802
+0.776
1.58%
jan 1, 1989
50.169
+0.367
0.74%
jan 1, 1990
50.478
+0.309
0.62%
jan 1, 1991
50.892
+0.414
0.82%
jan 1, 1992
50.56
-0.332
-0.65%
jan 1, 1993
51.133
+0.574
1.13%
jan 1, 1994
51.478
+0.345
0.67%
jan 1, 1995
51.646
+0.168
0.33%
jan 1, 1996
51.961
+0.315
0.61%
jan 1, 1997
52.147
+0.186
0.36%
jan 1, 1999
52.032
-0.115
-0.22%
jan 1, 2000
51.458
-0.573
-1.1%
jan 1, 2001
51.799
+0.341
0.66%
jan 1, 2002
51.581
-0.219
-0.42%
jan 1, 2003
51.829
+0.249
0.48%
jan 1, 2004
52.546
+0.716
1.38%
jan 1, 2005
52.456
-0.09
-0.17%
jan 1, 2006
51.756
-0.7
-1.33%
jan 1, 2007
51.355
-0.402
-0.78%
jan 1, 2008
51.112
-0.242
-0.47%
jan 1, 2009
51.187
+0.074
0.15%
jan 1, 2010
51.076
-0.111
-0.22%
jan 1, 2011
51.022
-0.054
-0.11%
jan 1, 2012
51.223
+0.2
0.39%
jan 1, 2013
50.929
-0.294
-0.57%
jan 1, 2014
51.287
+0.358
0.7%
jan 1, 2015
51.545
+0.258
0.5%
Ranking of countries by current statistics by years


Comments: