29
/
en
AIzaSyAYiBZKx7MnpbEhh9jyipgxe19OcubqV5w
April 1, 2024
120270
Djibouti
DJI
true
2
1
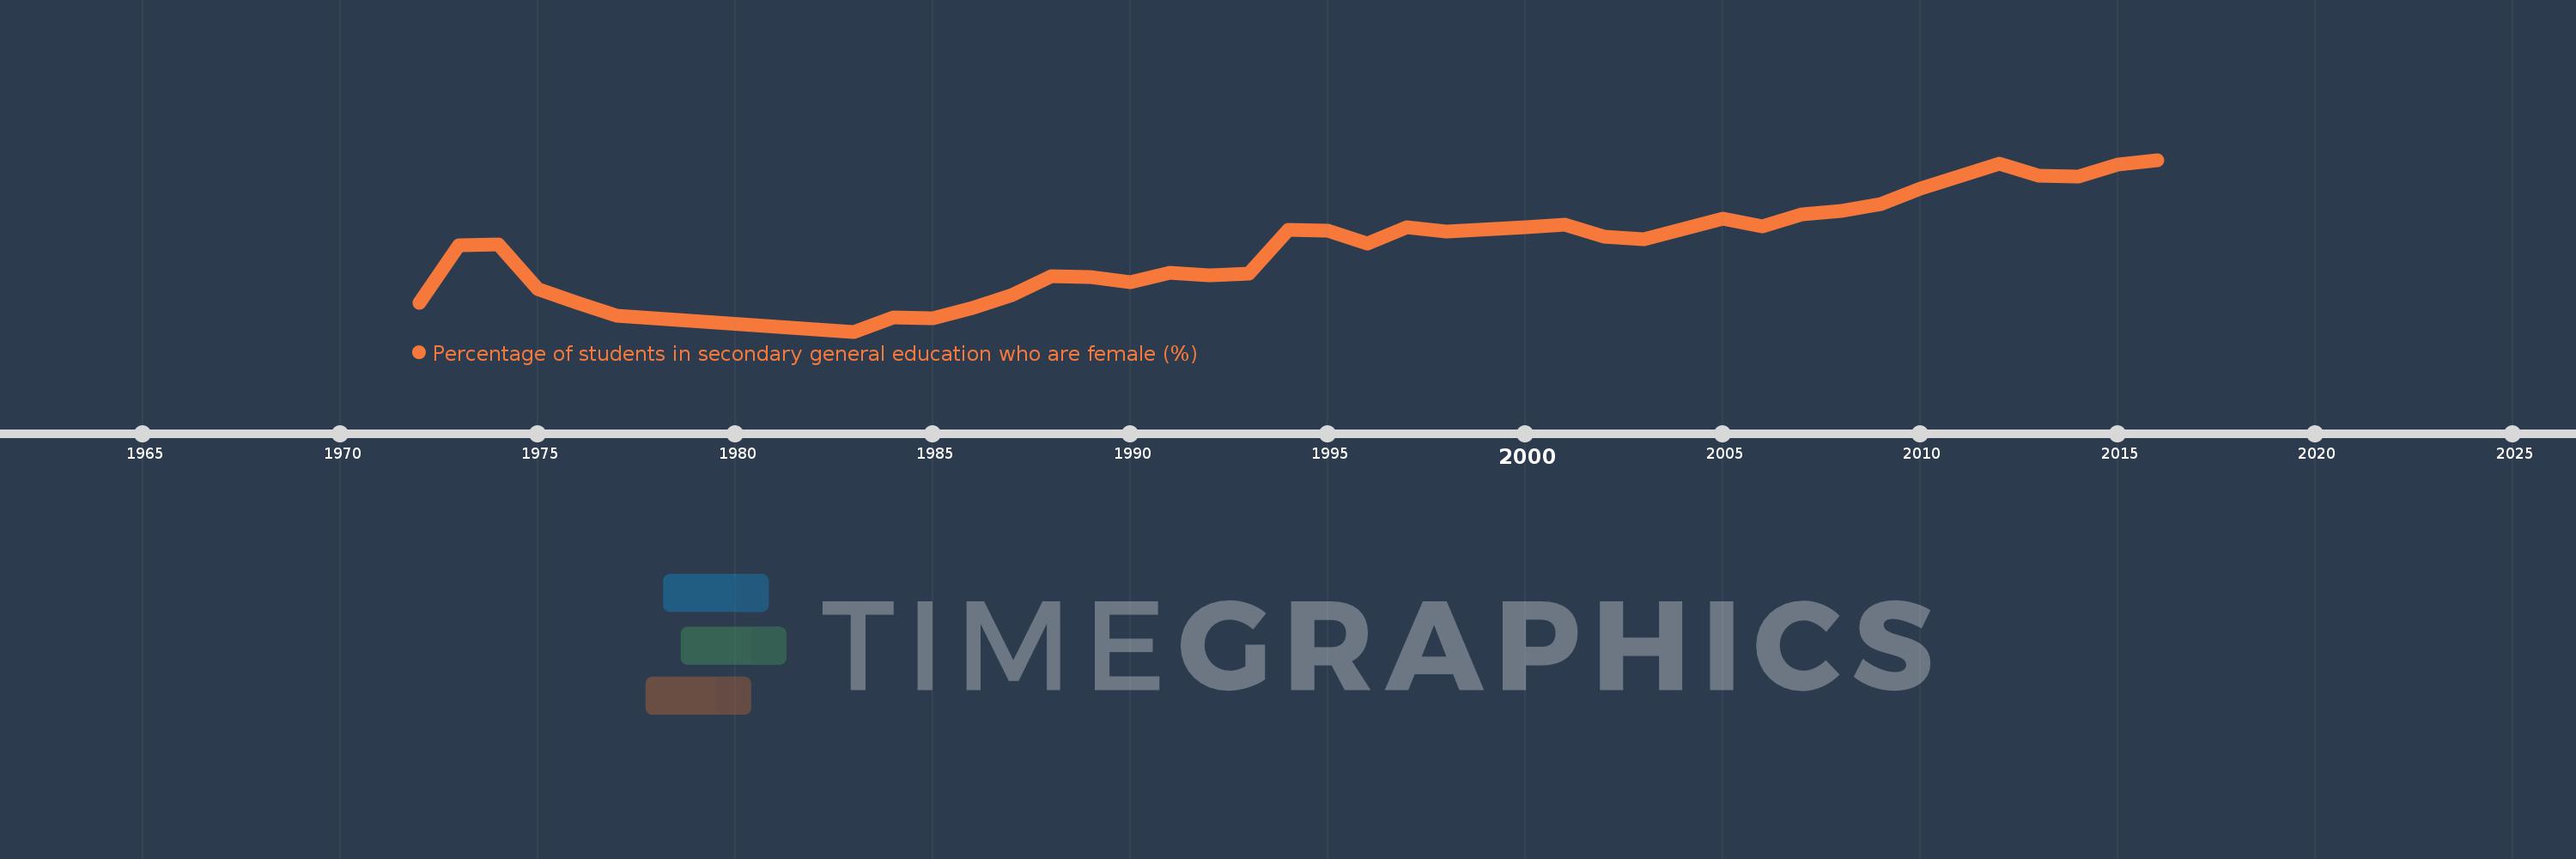
Percentage of students in secondary general education who are female (%)
2016,2015,2014,2013,2012,2010,2009,2008,2007,2006,2005,2003,2002,2001,2000,1998,1997,1996,1995,1994,1993,1992,1991,1990,1989,1988,1987,1986,1985,1984,1983,1977,1976,1975,1974,1973,1972
This statistics in other country:
AfghanistanAlbaniaAlgeriaAndorraAngolaAntigua and BarbudaArab WorldArgentinaArmeniaArubaAustraliaAustriaAzerbaijanBahamas, TheBahrainBangladeshBarbadosBelarusBelgiumBelizeBeninBermudaBhutanBoliviaBosnia and HerzegovinaBotswanaBrazilBritish Virgin IslandsBrunei DarussalamBulgariaBurkina FasoBurundiCabo VerdeCambodiaCameroonCanadaCaribbean small statesCayman IslandsCentral African RepublicCentral Europe and the BalticsChadChileChinaColombiaComorosCongo, Dem. Rep.Congo, Rep.Costa RicaCote d'IvoireCroatiaCubaCuracaoCyprusCzech RepublicDenmarkDjiboutiDominicaDominican RepublicEarly-demographic dividendEast Asia & PacificEast Asia & Pacific (excluding high income)East Asia & Pacific (IDA & IBRD countries)EcuadorEgypt, Arab Rep.El SalvadorEquatorial GuineaEritreaEstoniaEthiopiaEuro areaEurope & Central AsiaEurope & Central Asia (excluding high income)Europe & Central Asia (IDA & IBRD countries)European UnionFijiFinlandFragile and conflict affected situationsFranceGabonGambia, TheGeorgiaGermanyGhanaGibraltarGreeceGrenadaGuatemalaGuineaGuinea-BissauGuyanaHaitiHeavily indebted poor countries (HIPC)High incomeHondurasHong Kong SAR, ChinaHungaryIBRD onlyIcelandIDA & IBRD totalIDA blendIDA onlyIDA totalIndiaIndonesiaIran, Islamic Rep.IraqIrelandIsraelItalyJamaicaJapanJordanKazakhstanKenyaKiribatiKorea, Dem. People’s Rep.Korea, Rep.KuwaitKyrgyz RepublicLao PDRLate-demographic dividendLatin America & Caribbean Latin America & Caribbean (excluding high income)Latin America & the Caribbean (IDA & IBRD countries)LatviaLeast developed countries: UN classificationLebanonLesothoLiberiaLibyaLiechtensteinLithuaniaLow & middle incomeLow incomeLower middle incomeLuxembourgMacao SAR, ChinaMacedonia, FYRMadagascarMalawiMalaysiaMaldivesMaliMaltaMarshall IslandsMauritaniaMauritiusMexicoMicronesia, Fed. Sts.Middle East & North AfricaMiddle East & North Africa (excluding high income)Middle East & North Africa (IDA & IBRD countries)Middle incomeMoldovaMonacoMongoliaMontenegroMoroccoMozambiqueMyanmarNamibiaNauruNepalNetherlandsNew ZealandNicaraguaNigerNigeriaNorth AmericaNorwayOECD membersOmanOther small statesPacific island small statesPakistanPalauPanamaPapua New GuineaParaguayPeruPhilippinesPolandPortugalPost-demographic dividendPre-demographic dividendPuerto RicoQatarRomaniaRussian FederationRwandaSamoaSan MarinoSao Tome and PrincipeSaudi ArabiaSenegalSerbiaSeychellesSierra LeoneSingaporeSint Maarten (Dutch part)Slovak RepublicSloveniaSmall statesSolomon IslandsSomaliaSouth AfricaSouth AsiaSouth Asia (IDA & IBRD)South SudanSpainSri LankaSt. Kitts and NevisSt. LuciaSt. Vincent and the GrenadinesSub-Saharan Africa Sub-Saharan Africa (excluding high income)Sub-Saharan Africa (IDA & IBRD countries)SudanSurinameSwazilandSwedenSwitzerlandSyrian Arab RepublicTajikistanTanzaniaThailandTimor-LesteTogoTongaTrinidad and TobagoTunisiaTurkeyTurkmenistanTurks and Caicos IslandsTuvaluUgandaUkraineUnited Arab EmiratesUnited KingdomUnited StatesUpper middle incomeUruguayUzbekistanVanuatuVenezuela, RBVietnamWest Bank and GazaWorldYemen, Rep.ZambiaZimbabwe Timeline:
This timeline shows a graph from 1972 to 2016 of Djibouti. No data until 1971. Number of actual observations by date: 37.
Source name:
World Development Indicators
Source organization:
UNESCO Institute for Statistics
Categories, topics:
Education, Gender
Last updated:
apr 23, 2017
Indicators value changes by year
Minimum:
30.373
jan 1, 1983
Maximum:
44.404
jan 1, 2016
At the date of observation
Value
Absolute change
Change from previous value
jan 1, 1972
32.718
+32.718
0.0%
jan 1, 1973
37.395
+4.677
14.29%
jan 1, 1974
37.466
+0.071
0.19%
jan 1, 1975
33.848
-3.617
-9.65%
jan 1, 1976
32.754
-1.094
-3.23%
jan 1, 1977
31.688
-1.066
-3.25%
jan 1, 1983
30.373
-1.315
-4.15%
jan 1, 1984
31.542
+1.169
3.85%
jan 1, 1985
31.455
-0.087
-0.28%
jan 1, 1986
32.322
+0.867
2.76%
jan 1, 1987
33.379
+1.057
3.27%
jan 1, 1988
34.874
+1.495
4.48%
jan 1, 1989
34.799
-0.075
-0.22%
jan 1, 1990
34.409
-0.39
-1.12%
jan 1, 1991
35.156
+0.747
2.17%
jan 1, 1992
34.991
-0.166
-0.47%
jan 1, 1993
35.092
+0.101
0.29%
jan 1, 1994
38.699
+3.606
10.28%
jan 1, 1995
38.618
-0.081
-0.21%
jan 1, 1996
37.569
-1.049
-2.72%
jan 1, 1997
38.929
+1.36
3.62%
jan 1, 1998
38.533
-0.396
-1.02%
jan 1, 2000
38.876
+0.343
0.89%
jan 1, 2001
39.08
+0.205
0.53%
jan 1, 2002
38.11
-0.97
-2.48%
jan 1, 2003
37.889
-0.222
-0.58%
jan 1, 2005
39.578
+1.689
4.46%
jan 1, 2006
38.96
-0.618
-1.56%
jan 1, 2007
39.963
+1.003
2.57%
jan 1, 2008
40.229
+0.267
0.67%
jan 1, 2009
40.804
+0.575
1.43%
jan 1, 2010
42.032
+1.228
3.01%
jan 1, 2012
44.07
+2.038
4.85%
jan 1, 2013
43.087
-0.983
-2.23%
jan 1, 2014
43.025
-0.062
-0.14%
jan 1, 2015
44.004
+0.979
2.27%
jan 1, 2016
44.404
+0.401
0.91%
Ranking of countries by current statistics by years


Comments: