29
/
en
AIzaSyAYiBZKx7MnpbEhh9jyipgxe19OcubqV5w
April 1, 2024
231509
Rwanda
RWA
true
2
1
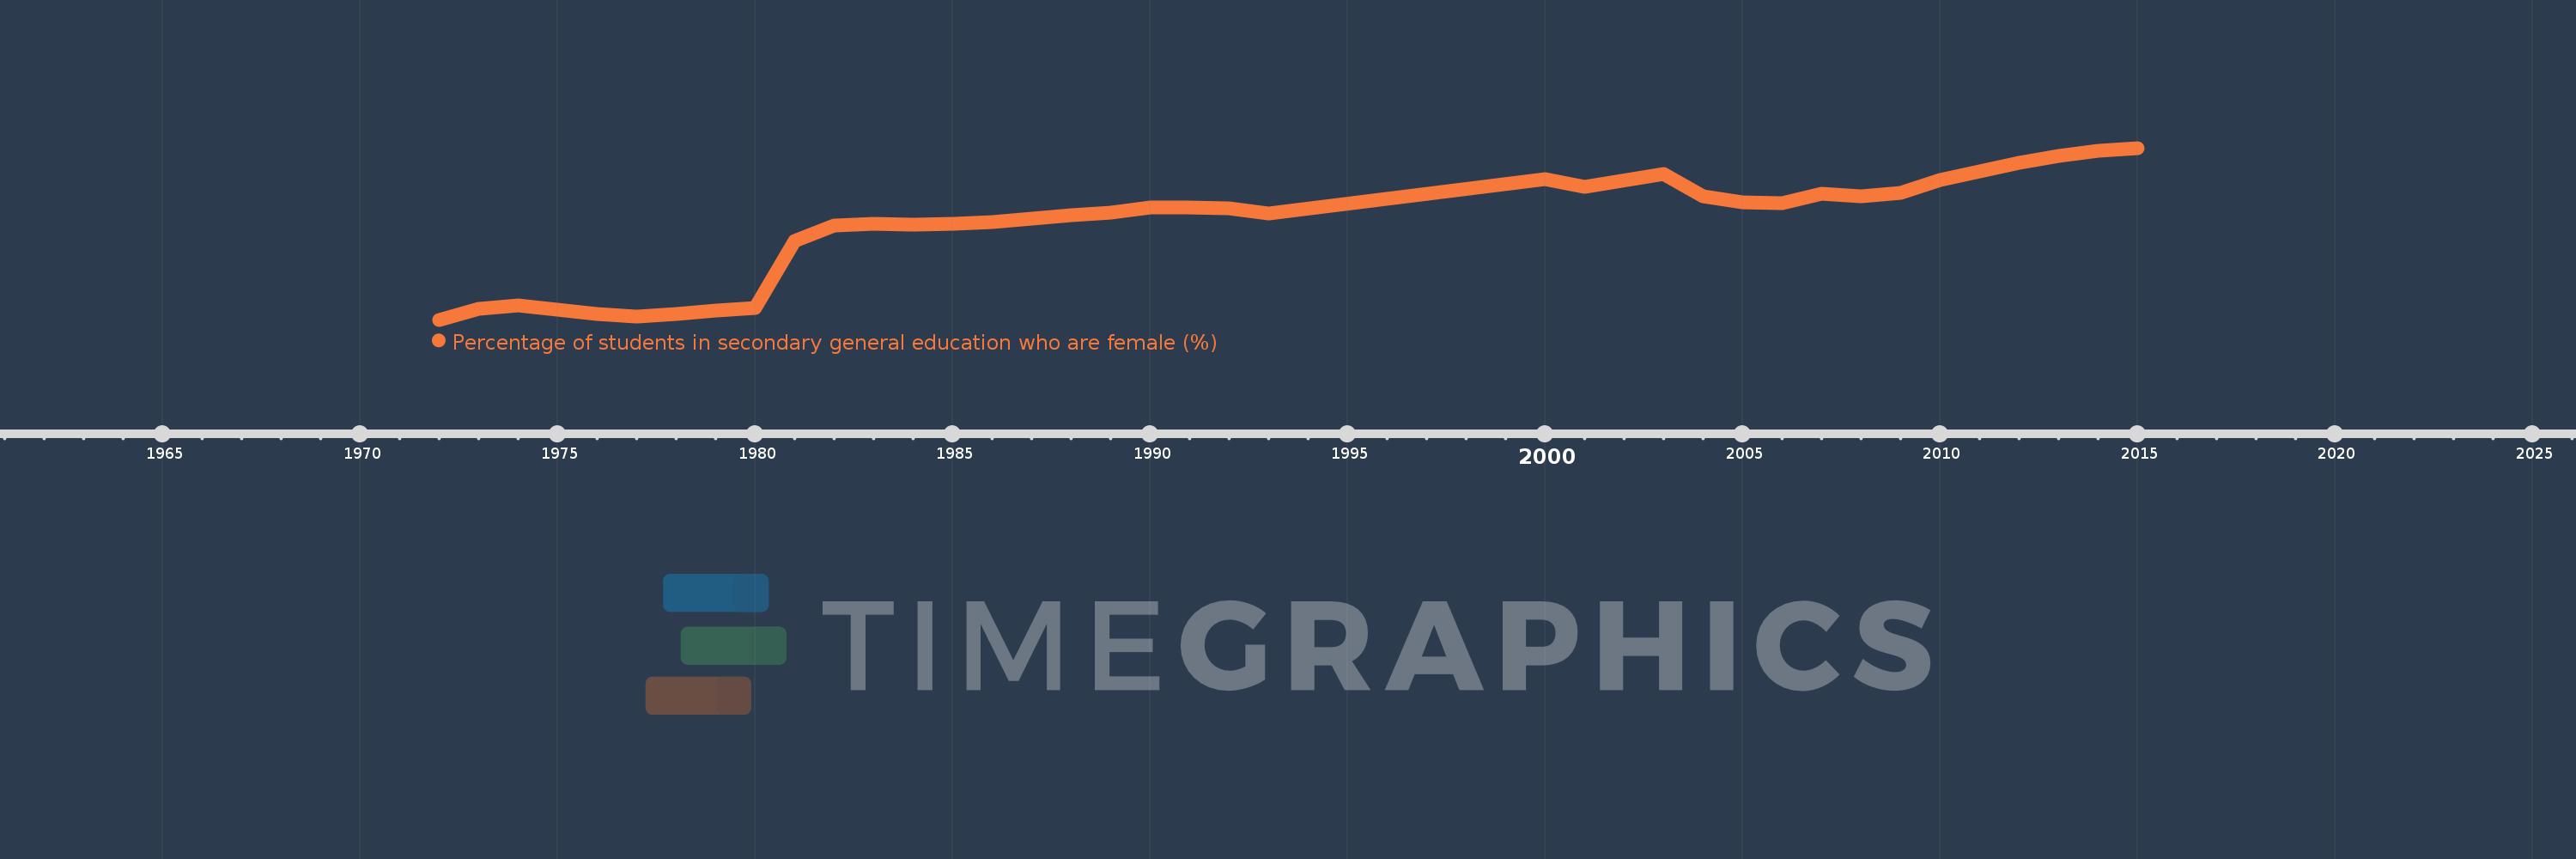
Percentage of students in secondary general education who are female (%)
2015,2014,2013,2012,2010,2009,2008,2007,2006,2005,2004,2003,2001,2000,1993,1992,1991,1990,1989,1988,1987,1986,1985,1984,1983,1982,1981,1980,1979,1978,1977,1976,1975,1974,1973,1972
This statistics in other country:
AfghanistanAlbaniaAlgeriaAndorraAngolaAntigua and BarbudaArab WorldArgentinaArmeniaArubaAustraliaAustriaAzerbaijanBahamas, TheBahrainBangladeshBarbadosBelarusBelgiumBelizeBeninBermudaBhutanBoliviaBosnia and HerzegovinaBotswanaBrazilBritish Virgin IslandsBrunei DarussalamBulgariaBurkina FasoBurundiCabo VerdeCambodiaCameroonCanadaCaribbean small statesCayman IslandsCentral African RepublicCentral Europe and the BalticsChadChileChinaColombiaComorosCongo, Dem. Rep.Congo, Rep.Costa RicaCote d'IvoireCroatiaCubaCuracaoCyprusCzech RepublicDenmarkDjiboutiDominicaDominican RepublicEarly-demographic dividendEast Asia & PacificEast Asia & Pacific (excluding high income)East Asia & Pacific (IDA & IBRD countries)EcuadorEgypt, Arab Rep.El SalvadorEquatorial GuineaEritreaEstoniaEthiopiaEuro areaEurope & Central AsiaEurope & Central Asia (excluding high income)Europe & Central Asia (IDA & IBRD countries)European UnionFijiFinlandFragile and conflict affected situationsFranceGabonGambia, TheGeorgiaGermanyGhanaGibraltarGreeceGrenadaGuatemalaGuineaGuinea-BissauGuyanaHaitiHeavily indebted poor countries (HIPC)High incomeHondurasHong Kong SAR, ChinaHungaryIBRD onlyIcelandIDA & IBRD totalIDA blendIDA onlyIDA totalIndiaIndonesiaIran, Islamic Rep.IraqIrelandIsraelItalyJamaicaJapanJordanKazakhstanKenyaKiribatiKorea, Dem. People’s Rep.Korea, Rep.KuwaitKyrgyz RepublicLao PDRLate-demographic dividendLatin America & Caribbean Latin America & Caribbean (excluding high income)Latin America & the Caribbean (IDA & IBRD countries)LatviaLeast developed countries: UN classificationLebanonLesothoLiberiaLibyaLiechtensteinLithuaniaLow & middle incomeLow incomeLower middle incomeLuxembourgMacao SAR, ChinaMacedonia, FYRMadagascarMalawiMalaysiaMaldivesMaliMaltaMarshall IslandsMauritaniaMauritiusMexicoMicronesia, Fed. Sts.Middle East & North AfricaMiddle East & North Africa (excluding high income)Middle East & North Africa (IDA & IBRD countries)Middle incomeMoldovaMonacoMongoliaMontenegroMoroccoMozambiqueMyanmarNamibiaNauruNepalNetherlandsNew ZealandNicaraguaNigerNigeriaNorth AmericaNorwayOECD membersOmanOther small statesPacific island small statesPakistanPalauPanamaPapua New GuineaParaguayPeruPhilippinesPolandPortugalPost-demographic dividendPre-demographic dividendPuerto RicoQatarRomaniaRussian FederationRwandaSamoaSan MarinoSao Tome and PrincipeSaudi ArabiaSenegalSerbiaSeychellesSierra LeoneSingaporeSint Maarten (Dutch part)Slovak RepublicSloveniaSmall statesSolomon IslandsSomaliaSouth AfricaSouth AsiaSouth Asia (IDA & IBRD)South SudanSpainSri LankaSt. Kitts and NevisSt. LuciaSt. Vincent and the GrenadinesSub-Saharan Africa Sub-Saharan Africa (excluding high income)Sub-Saharan Africa (IDA & IBRD countries)SudanSurinameSwazilandSwedenSwitzerlandSyrian Arab RepublicTajikistanTanzaniaThailandTimor-LesteTogoTongaTrinidad and TobagoTunisiaTurkeyTurkmenistanTurks and Caicos IslandsTuvaluUgandaUkraineUnited Arab EmiratesUnited KingdomUnited StatesUpper middle incomeUruguayUzbekistanVanuatuVenezuela, RBVietnamWest Bank and GazaWorldYemen, Rep.ZambiaZimbabwe Timeline:
This timeline shows a graph from 1972 to 2015 of Rwanda. No data until 1971. Number of actual observations by date: 36.
Source name:
World Development Indicators
Source organization:
UNESCO Institute for Statistics
Categories, topics:
Education, Gender
Last updated:
apr 23, 2017
Indicators value changes by year
Minimum:
30.373
jan 1, 1972
Maximum:
53.785
jan 1, 2015
At the date of observation
Value
Absolute change
Change from previous value
jan 1, 1972
30.373
+30.373
0.0%
jan 1, 1973
31.828
+1.455
4.79%
jan 1, 1974
32.351
+0.524
1.64%
jan 1, 1975
31.771
-0.581
-1.79%
jan 1, 1976
31.166
-0.605
-1.9%
jan 1, 1977
30.79
-0.375
-1.2%
jan 1, 1978
31.206
+0.416
1.35%
jan 1, 1979
31.638
+0.431
1.38%
jan 1, 1980
31.954
+0.316
1.0%
jan 1, 1981
41.072
+9.117
28.53%
jan 1, 1982
43.245
+2.173
5.29%
jan 1, 1983
43.499
+0.254
0.59%
jan 1, 1984
43.312
-0.187
-0.43%
jan 1, 1985
43.468
+0.155
0.36%
jan 1, 1986
43.716
+0.248
0.57%
jan 1, 1987
44.202
+0.486
1.11%
jan 1, 1988
44.596
+0.394
0.89%
jan 1, 1989
45.022
+0.426
0.96%
jan 1, 1990
45.63
+0.607
1.35%
jan 1, 1991
45.646
+0.016
0.04%
jan 1, 1992
45.608
-0.039
-0.08%
jan 1, 1993
44.828
-0.78
-1.71%
jan 1, 2000
49.515
+4.687
10.46%
jan 1, 2001
48.477
-1.038
-2.1%
jan 1, 2003
50.223
+1.746
3.6%
jan 1, 2004
47.245
-2.978
-5.93%
jan 1, 2005
46.431
-0.815
-1.72%
jan 1, 2006
46.211
-0.22
-0.47%
jan 1, 2007
47.541
+1.33
2.88%
jan 1, 2008
47.198
-0.343
-0.72%
jan 1, 2009
47.621
+0.422
0.89%
jan 1, 2010
49.367
+1.746
3.67%
jan 1, 2012
51.798
+2.431
4.92%
jan 1, 2013
52.701
+0.904
1.74%
jan 1, 2014
53.406
+0.705
1.34%
jan 1, 2015
53.785
+0.379
0.71%
Ranking of countries by current statistics by years


Comments: