29
/
en
AIzaSyAYiBZKx7MnpbEhh9jyipgxe19OcubqV5w
April 1, 2024
208307
Netherlands
NLD
true
2
1
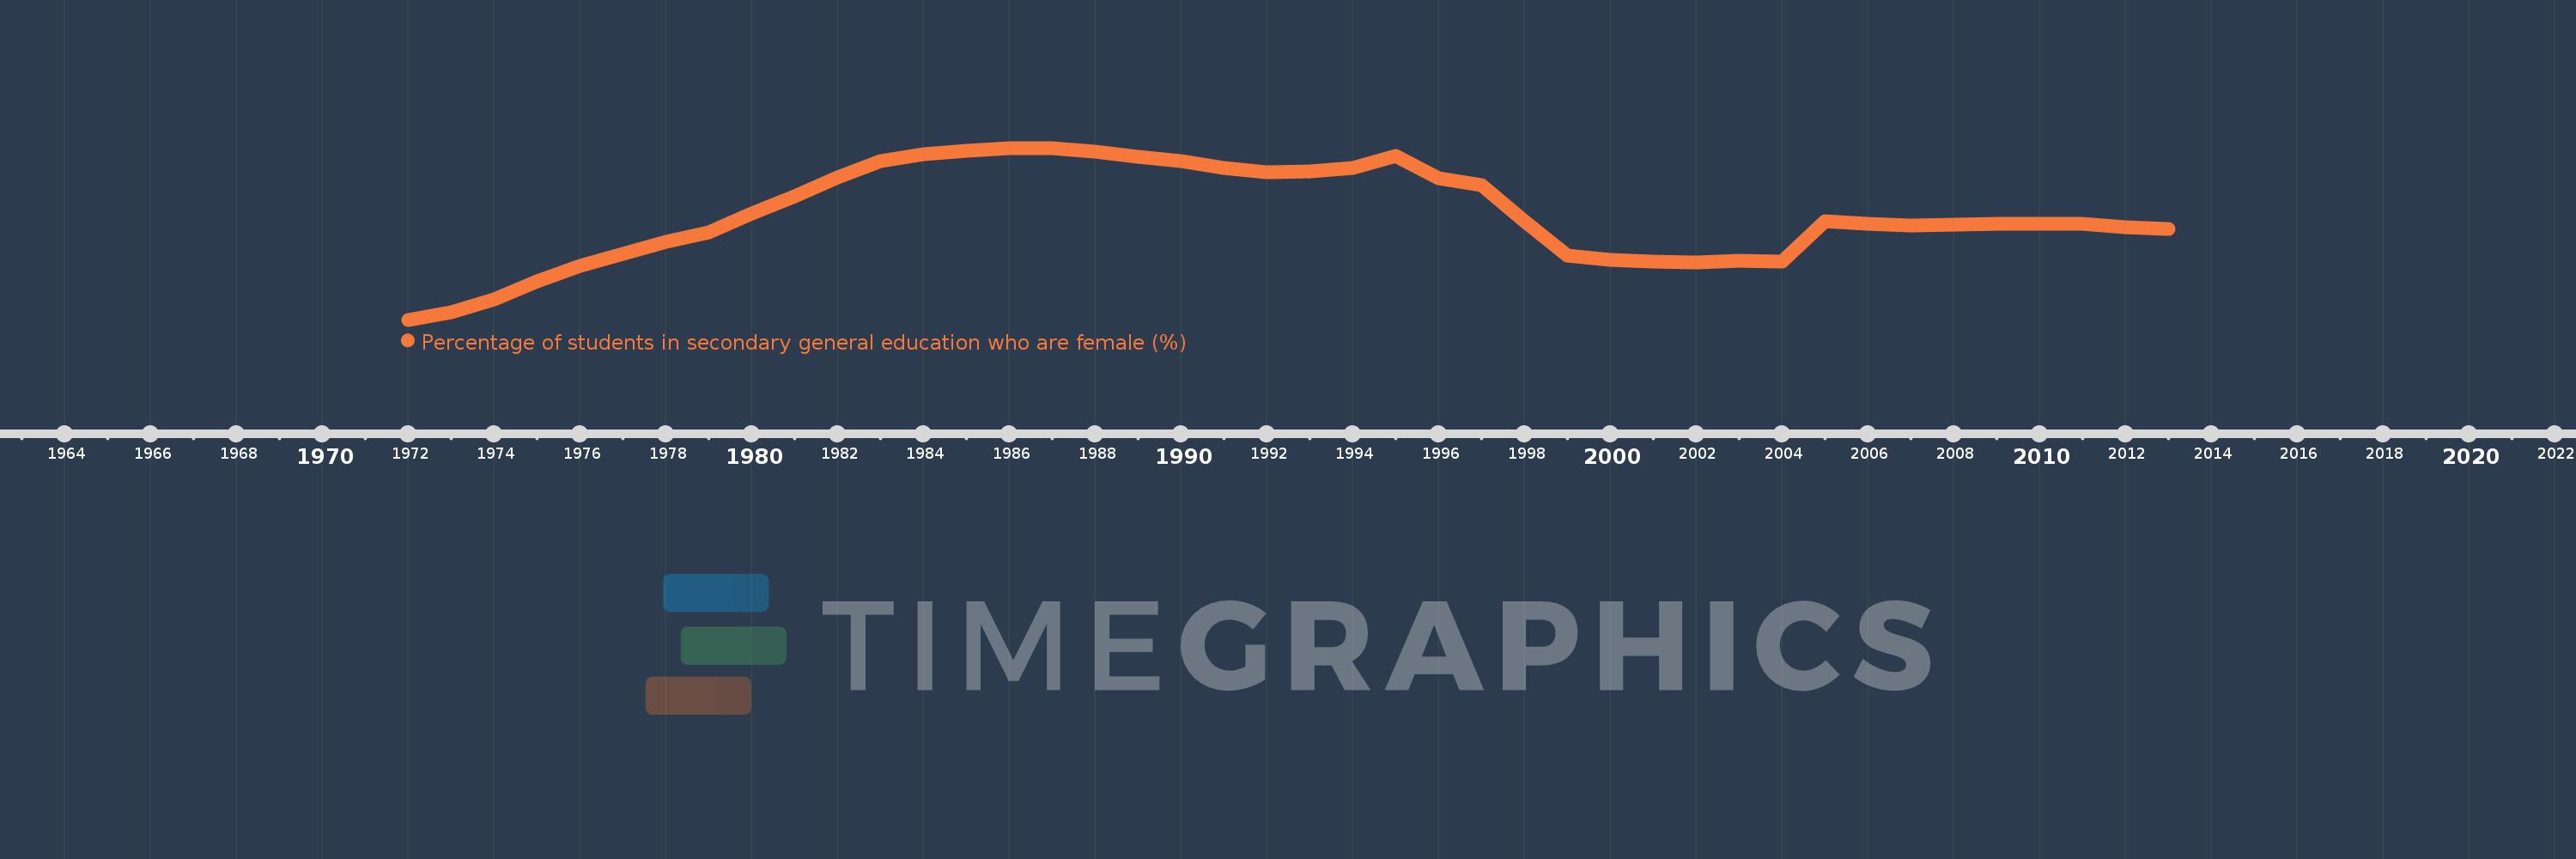
Percentage of students in secondary general education who are female (%)
2013,2012,2011,2010,2009,2008,2007,2006,2005,2004,2003,2002,2001,2000,1999,1998,1997,1996,1995,1994,1993,1992,1991,1990,1989,1988,1987,1986,1985,1984,1983,1982,1981,1980,1979,1978,1977,1976,1975,1974,1973,1972
This statistics in other country:
AfghanistanAlbaniaAlgeriaAndorraAngolaAntigua and BarbudaArab WorldArgentinaArmeniaArubaAustraliaAustriaAzerbaijanBahamas, TheBahrainBangladeshBarbadosBelarusBelgiumBelizeBeninBermudaBhutanBoliviaBosnia and HerzegovinaBotswanaBrazilBritish Virgin IslandsBrunei DarussalamBulgariaBurkina FasoBurundiCabo VerdeCambodiaCameroonCanadaCaribbean small statesCayman IslandsCentral African RepublicCentral Europe and the BalticsChadChileChinaColombiaComorosCongo, Dem. Rep.Congo, Rep.Costa RicaCote d'IvoireCroatiaCubaCuracaoCyprusCzech RepublicDenmarkDjiboutiDominicaDominican RepublicEarly-demographic dividendEast Asia & PacificEast Asia & Pacific (excluding high income)East Asia & Pacific (IDA & IBRD countries)EcuadorEgypt, Arab Rep.El SalvadorEquatorial GuineaEritreaEstoniaEthiopiaEuro areaEurope & Central AsiaEurope & Central Asia (excluding high income)Europe & Central Asia (IDA & IBRD countries)European UnionFijiFinlandFragile and conflict affected situationsFranceGabonGambia, TheGeorgiaGermanyGhanaGibraltarGreeceGrenadaGuatemalaGuineaGuinea-BissauGuyanaHaitiHeavily indebted poor countries (HIPC)High incomeHondurasHong Kong SAR, ChinaHungaryIBRD onlyIcelandIDA & IBRD totalIDA blendIDA onlyIDA totalIndiaIndonesiaIran, Islamic Rep.IraqIrelandIsraelItalyJamaicaJapanJordanKazakhstanKenyaKiribatiKorea, Dem. People’s Rep.Korea, Rep.KuwaitKyrgyz RepublicLao PDRLate-demographic dividendLatin America & Caribbean Latin America & Caribbean (excluding high income)Latin America & the Caribbean (IDA & IBRD countries)LatviaLeast developed countries: UN classificationLebanonLesothoLiberiaLibyaLiechtensteinLithuaniaLow & middle incomeLow incomeLower middle incomeLuxembourgMacao SAR, ChinaMacedonia, FYRMadagascarMalawiMalaysiaMaldivesMaliMaltaMarshall IslandsMauritaniaMauritiusMexicoMicronesia, Fed. Sts.Middle East & North AfricaMiddle East & North Africa (excluding high income)Middle East & North Africa (IDA & IBRD countries)Middle incomeMoldovaMonacoMongoliaMontenegroMoroccoMozambiqueMyanmarNamibiaNauruNepalNetherlandsNew ZealandNicaraguaNigerNigeriaNorth AmericaNorwayOECD membersOmanOther small statesPacific island small statesPakistanPalauPanamaPapua New GuineaParaguayPeruPhilippinesPolandPortugalPost-demographic dividendPre-demographic dividendPuerto RicoQatarRomaniaRussian FederationRwandaSamoaSan MarinoSao Tome and PrincipeSaudi ArabiaSenegalSerbiaSeychellesSierra LeoneSingaporeSint Maarten (Dutch part)Slovak RepublicSloveniaSmall statesSolomon IslandsSomaliaSouth AfricaSouth AsiaSouth Asia (IDA & IBRD)South SudanSpainSri LankaSt. Kitts and NevisSt. LuciaSt. Vincent and the GrenadinesSub-Saharan Africa Sub-Saharan Africa (excluding high income)Sub-Saharan Africa (IDA & IBRD countries)SudanSurinameSwazilandSwedenSwitzerlandSyrian Arab RepublicTajikistanTanzaniaThailandTimor-LesteTogoTongaTrinidad and TobagoTunisiaTurkeyTurkmenistanTurks and Caicos IslandsTuvaluUgandaUkraineUnited Arab EmiratesUnited KingdomUnited StatesUpper middle incomeUruguayUzbekistanVanuatuVenezuela, RBVietnamWest Bank and GazaWorldYemen, Rep.ZambiaZimbabwe Timeline:
This timeline shows a graph from 1972 to 2013 of Netherlands. No data until 1971. Number of actual observations by date: 42.
Source name:
World Development Indicators
Source organization:
UNESCO Institute for Statistics
Categories, topics:
Education, Gender
Last updated:
apr 23, 2017
Indicators value changes by year
Minimum:
47.569
jan 1, 1972
At the date of observation
Value
Absolute change
Change from previous value
jan 1, 1972
47.569
+47.569
0.0%
jan 1, 1973
47.808
+0.239
0.5%
jan 1, 1974
48.193
+0.385
0.81%
jan 1, 1975
48.746
+0.553
1.15%
jan 1, 1976
49.234
+0.489
1.0%
jan 1, 1977
49.598
+0.363
0.74%
jan 1, 1978
49.986
+0.388
0.78%
jan 1, 1979
50.277
+0.291
0.58%
jan 1, 1980
50.852
+0.575
1.14%
jan 1, 1981
51.38
+0.528
1.04%
jan 1, 1982
51.989
+0.609
1.19%
jan 1, 1983
52.476
+0.486
0.94%
jan 1, 1984
52.698
+0.222
0.42%
jan 1, 1985
52.803
+0.104
0.2%
jan 1, 1986
52.876
+0.073
0.14%
jan 1, 1987
52.89
+0.014
0.03%
jan 1, 1988
52.769
-0.121
-0.23%
jan 1, 1989
52.621
-0.148
-0.28%
jan 1, 1990
52.482
-0.139
-0.26%
jan 1, 1991
52.282
-0.2
-0.38%
jan 1, 1992
52.132
-0.15
-0.29%
jan 1, 1993
52.171
+0.039
0.07%
jan 1, 1994
52.281
+0.11
0.21%
jan 1, 1995
52.63
+0.35
0.67%
jan 1, 1996
51.958
-0.672
-1.28%
jan 1, 1997
51.735
-0.223
-0.43%
jan 1, 1998
50.615
-1.12
-2.16%
jan 1, 1999
49.555
-1.061
-2.1%
jan 1, 2000
49.413
-0.142
-0.29%
jan 1, 2001
49.366
-0.047
-0.09%
jan 1, 2002
49.356
-0.01
-0.02%
jan 1, 2003
49.386
+0.03
0.06%
jan 1, 2004
49.366
-0.02
-0.04%
jan 1, 2005
50.611
+1.245
2.52%
jan 1, 2006
50.535
-0.076
-0.15%
jan 1, 2007
50.489
-0.046
-0.09%
jan 1, 2008
50.501
+0.011
0.02%
jan 1, 2009
50.537
+0.036
0.07%
jan 1, 2010
50.53
-0.007
-0.01%
jan 1, 2011
50.538
+0.007
0.01%
jan 1, 2012
50.432
-0.105
-0.21%
jan 1, 2013
50.392
-0.04
-0.08%
Ranking of countries by current statistics by years


Comments: