29
/
en
AIzaSyAYiBZKx7MnpbEhh9jyipgxe19OcubqV5w
April 1, 2024
49380
Middle East & North Africa (excluding high income)
MNA
false
2
1
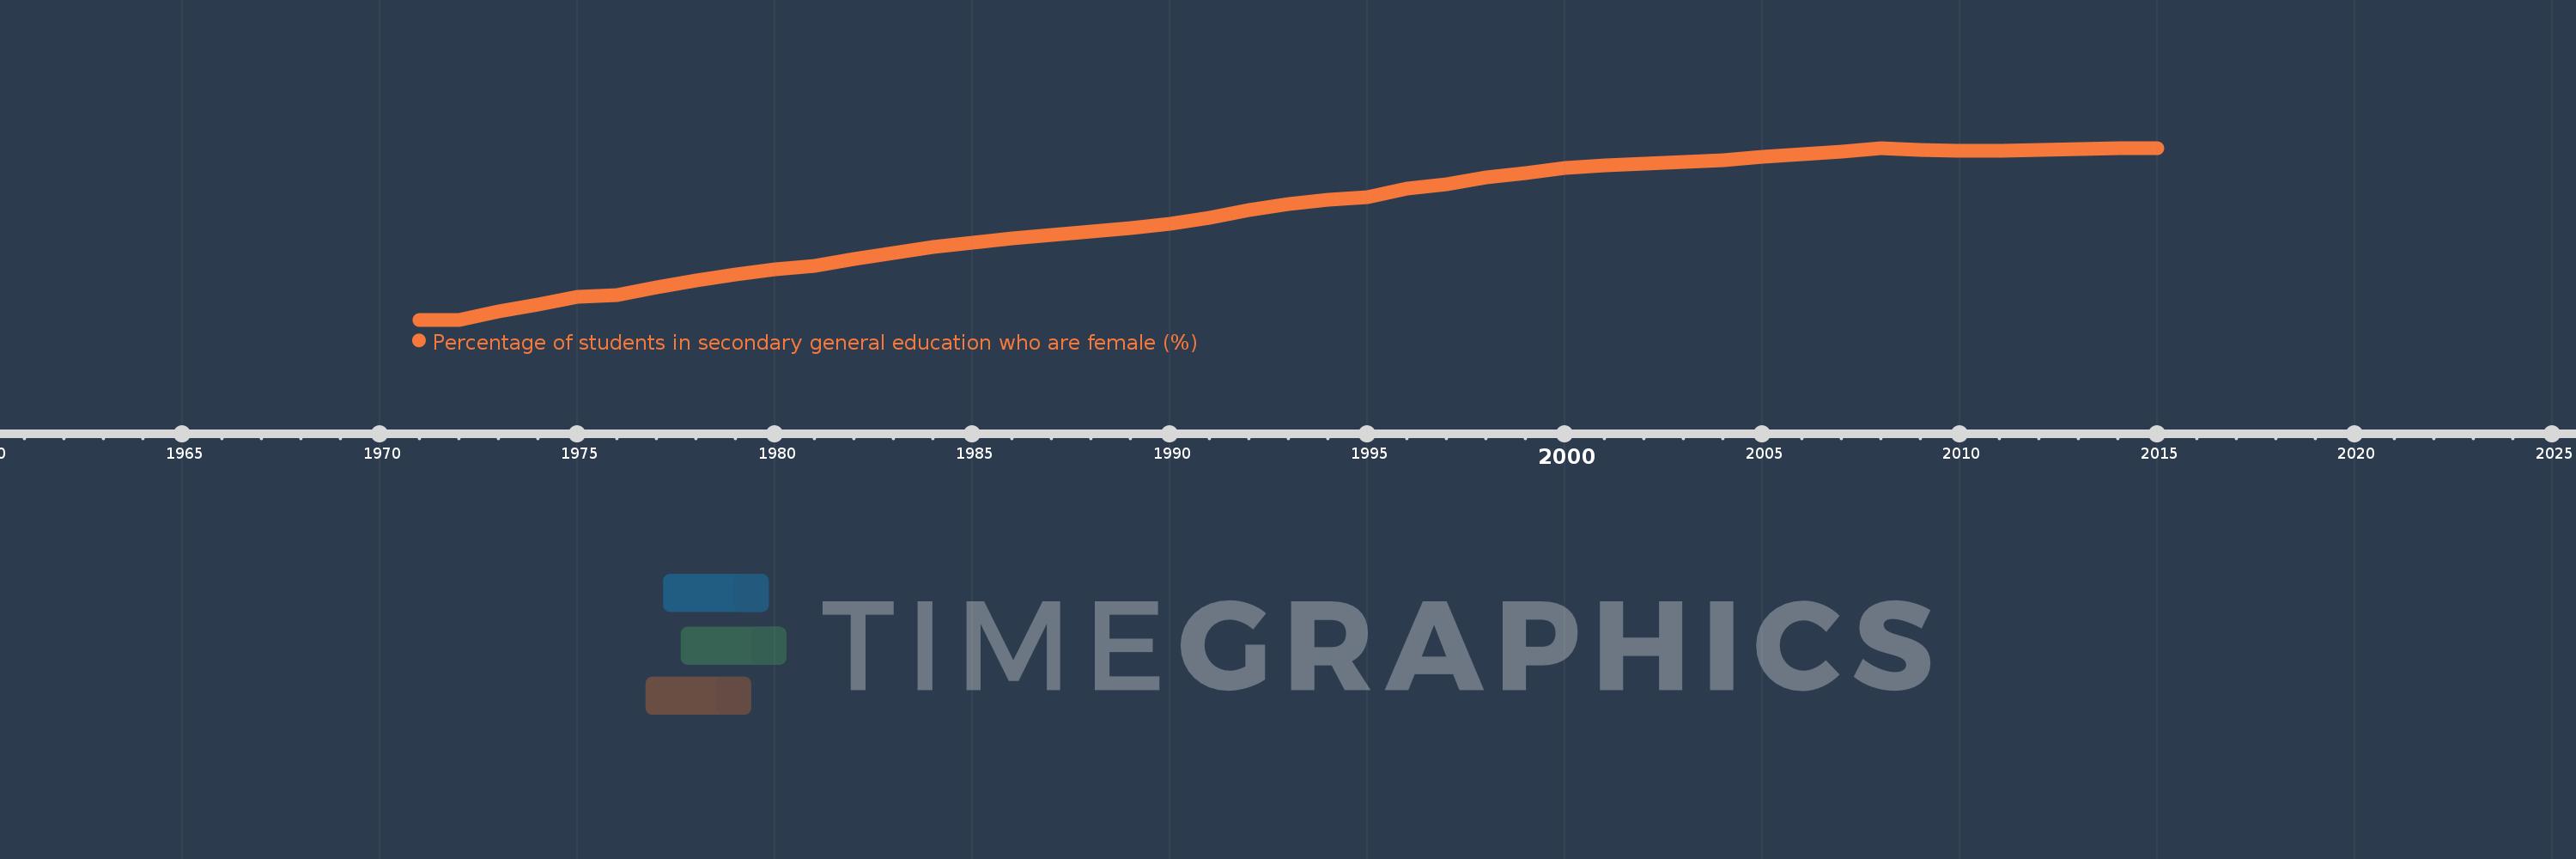
Percentage of students in secondary general education who are female (%)
2015,2014,2013,2012,2011,2010,2009,2008,2007,2006,2005,2004,2003,2002,2001,2000,1999,1998,1997,1996,1995,1994,1993,1992,1991,1990,1989,1988,1987,1986,1985,1984,1983,1982,1981,1980,1979,1978,1977,1976,1975,1974,1973,1972,1971
This statistics in other country:
AfghanistanAlbaniaAlgeriaAndorraAngolaAntigua and BarbudaArab WorldArgentinaArmeniaArubaAustraliaAustriaAzerbaijanBahamas, TheBahrainBangladeshBarbadosBelarusBelgiumBelizeBeninBermudaBhutanBoliviaBosnia and HerzegovinaBotswanaBrazilBritish Virgin IslandsBrunei DarussalamBulgariaBurkina FasoBurundiCabo VerdeCambodiaCameroonCanadaCaribbean small statesCayman IslandsCentral African RepublicCentral Europe and the BalticsChadChileChinaColombiaComorosCongo, Dem. Rep.Congo, Rep.Costa RicaCote d'IvoireCroatiaCubaCuracaoCyprusCzech RepublicDenmarkDjiboutiDominicaDominican RepublicEarly-demographic dividendEast Asia & PacificEast Asia & Pacific (excluding high income)East Asia & Pacific (IDA & IBRD countries)EcuadorEgypt, Arab Rep.El SalvadorEquatorial GuineaEritreaEstoniaEthiopiaEuro areaEurope & Central AsiaEurope & Central Asia (excluding high income)Europe & Central Asia (IDA & IBRD countries)European UnionFijiFinlandFragile and conflict affected situationsFranceGabonGambia, TheGeorgiaGermanyGhanaGibraltarGreeceGrenadaGuatemalaGuineaGuinea-BissauGuyanaHaitiHeavily indebted poor countries (HIPC)High incomeHondurasHong Kong SAR, ChinaHungaryIBRD onlyIcelandIDA & IBRD totalIDA blendIDA onlyIDA totalIndiaIndonesiaIran, Islamic Rep.IraqIrelandIsraelItalyJamaicaJapanJordanKazakhstanKenyaKiribatiKorea, Dem. People’s Rep.Korea, Rep.KuwaitKyrgyz RepublicLao PDRLate-demographic dividendLatin America & Caribbean Latin America & Caribbean (excluding high income)Latin America & the Caribbean (IDA & IBRD countries)LatviaLeast developed countries: UN classificationLebanonLesothoLiberiaLibyaLiechtensteinLithuaniaLow & middle incomeLow incomeLower middle incomeLuxembourgMacao SAR, ChinaMacedonia, FYRMadagascarMalawiMalaysiaMaldivesMaliMaltaMarshall IslandsMauritaniaMauritiusMexicoMicronesia, Fed. Sts.Middle East & North AfricaMiddle East & North Africa (excluding high income)Middle East & North Africa (IDA & IBRD countries)Middle incomeMoldovaMonacoMongoliaMontenegroMoroccoMozambiqueMyanmarNamibiaNauruNepalNetherlandsNew ZealandNicaraguaNigerNigeriaNorth AmericaNorwayOECD membersOmanOther small statesPacific island small statesPakistanPalauPanamaPapua New GuineaParaguayPeruPhilippinesPolandPortugalPost-demographic dividendPre-demographic dividendPuerto RicoQatarRomaniaRussian FederationRwandaSamoaSan MarinoSao Tome and PrincipeSaudi ArabiaSenegalSerbiaSeychellesSierra LeoneSingaporeSint Maarten (Dutch part)Slovak RepublicSloveniaSmall statesSolomon IslandsSomaliaSouth AfricaSouth AsiaSouth Asia (IDA & IBRD)South SudanSpainSri LankaSt. Kitts and NevisSt. LuciaSt. Vincent and the GrenadinesSub-Saharan Africa Sub-Saharan Africa (excluding high income)Sub-Saharan Africa (IDA & IBRD countries)SudanSurinameSwazilandSwedenSwitzerlandSyrian Arab RepublicTajikistanTanzaniaThailandTimor-LesteTogoTongaTrinidad and TobagoTunisiaTurkeyTurkmenistanTurks and Caicos IslandsTuvaluUgandaUkraineUnited Arab EmiratesUnited KingdomUnited StatesUpper middle incomeUruguayUzbekistanVanuatuVenezuela, RBVietnamWest Bank and GazaWorldYemen, Rep.ZambiaZimbabwe Timeline:
This timeline shows a graph from 1971 to 2015 of Middle East & North Africa (excluding high income). No data until 1970. Number of actual observations by date: 45.
Source name:
World Development Indicators
Source organization:
UNESCO Institute for Statistics
Categories, topics:
Education, Gender
Last updated:
apr 23, 2017
Indicators value changes by year
Minimum:
31.443
jan 1, 1972
Maximum:
48.623
jan 1, 2008
At the date of observation
Value
Absolute change
Change from previous value
jan 1, 1971
31.457
+31.457
0.0%
jan 1, 1972
31.443
-0.014
-0.04%
jan 1, 1973
32.302
+0.86
2.73%
jan 1, 1974
33.003
+0.701
2.17%
jan 1, 1975
33.708
+0.704
2.13%
jan 1, 1976
33.95
+0.242
0.72%
jan 1, 1977
34.708
+0.759
2.23%
jan 1, 1978
35.385
+0.677
1.95%
jan 1, 1979
35.934
+0.549
1.55%
jan 1, 1980
36.474
+0.54
1.5%
jan 1, 1981
36.82
+0.346
0.95%
jan 1, 1982
37.551
+0.731
1.99%
jan 1, 1983
38.132
+0.581
1.55%
jan 1, 1984
38.729
+0.597
1.57%
jan 1, 1985
39.173
+0.444
1.15%
jan 1, 1986
39.605
+0.432
1.1%
jan 1, 1987
39.929
+0.324
0.82%
jan 1, 1988
40.23
+0.301
0.75%
jan 1, 1989
40.605
+0.375
0.93%
jan 1, 1990
41.023
+0.418
1.03%
jan 1, 1991
41.661
+0.638
1.56%
jan 1, 1992
42.372
+0.711
1.71%
jan 1, 1993
43.025
+0.654
1.54%
jan 1, 1994
43.478
+0.453
1.05%
jan 1, 1995
43.697
+0.218
0.5%
jan 1, 1996
44.565
+0.868
1.99%
jan 1, 1997
45.009
+0.444
1.0%
jan 1, 1998
45.683
+0.674
1.5%
jan 1, 1999
46.121
+0.438
0.96%
jan 1, 2000
46.588
+0.467
1.01%
jan 1, 2001
46.881
+0.293
0.63%
jan 1, 2002
47.034
+0.152
0.33%
jan 1, 2003
47.259
+0.225
0.48%
jan 1, 2004
47.437
+0.178
0.38%
jan 1, 2005
47.766
+0.329
0.69%
jan 1, 2006
47.965
+0.199
0.42%
jan 1, 2007
48.215
+0.251
0.52%
jan 1, 2008
48.623
+0.407
0.85%
jan 1, 2009
48.459
-0.164
-0.34%
jan 1, 2010
48.346
-0.113
-0.23%
jan 1, 2011
48.37
+0.024
0.05%
jan 1, 2012
48.461
+0.091
0.19%
jan 1, 2013
48.511
+0.049
0.1%
jan 1, 2014
48.599
+0.088
0.18%
jan 1, 2015
48.588
-0.011
-0.02%
Ranking of countries by current statistics by years


Comments: