29
/
en
AIzaSyAYiBZKx7MnpbEhh9jyipgxe19OcubqV5w
April 1, 2024
250206
St. Kitts and Nevis
KNA
true
2
1
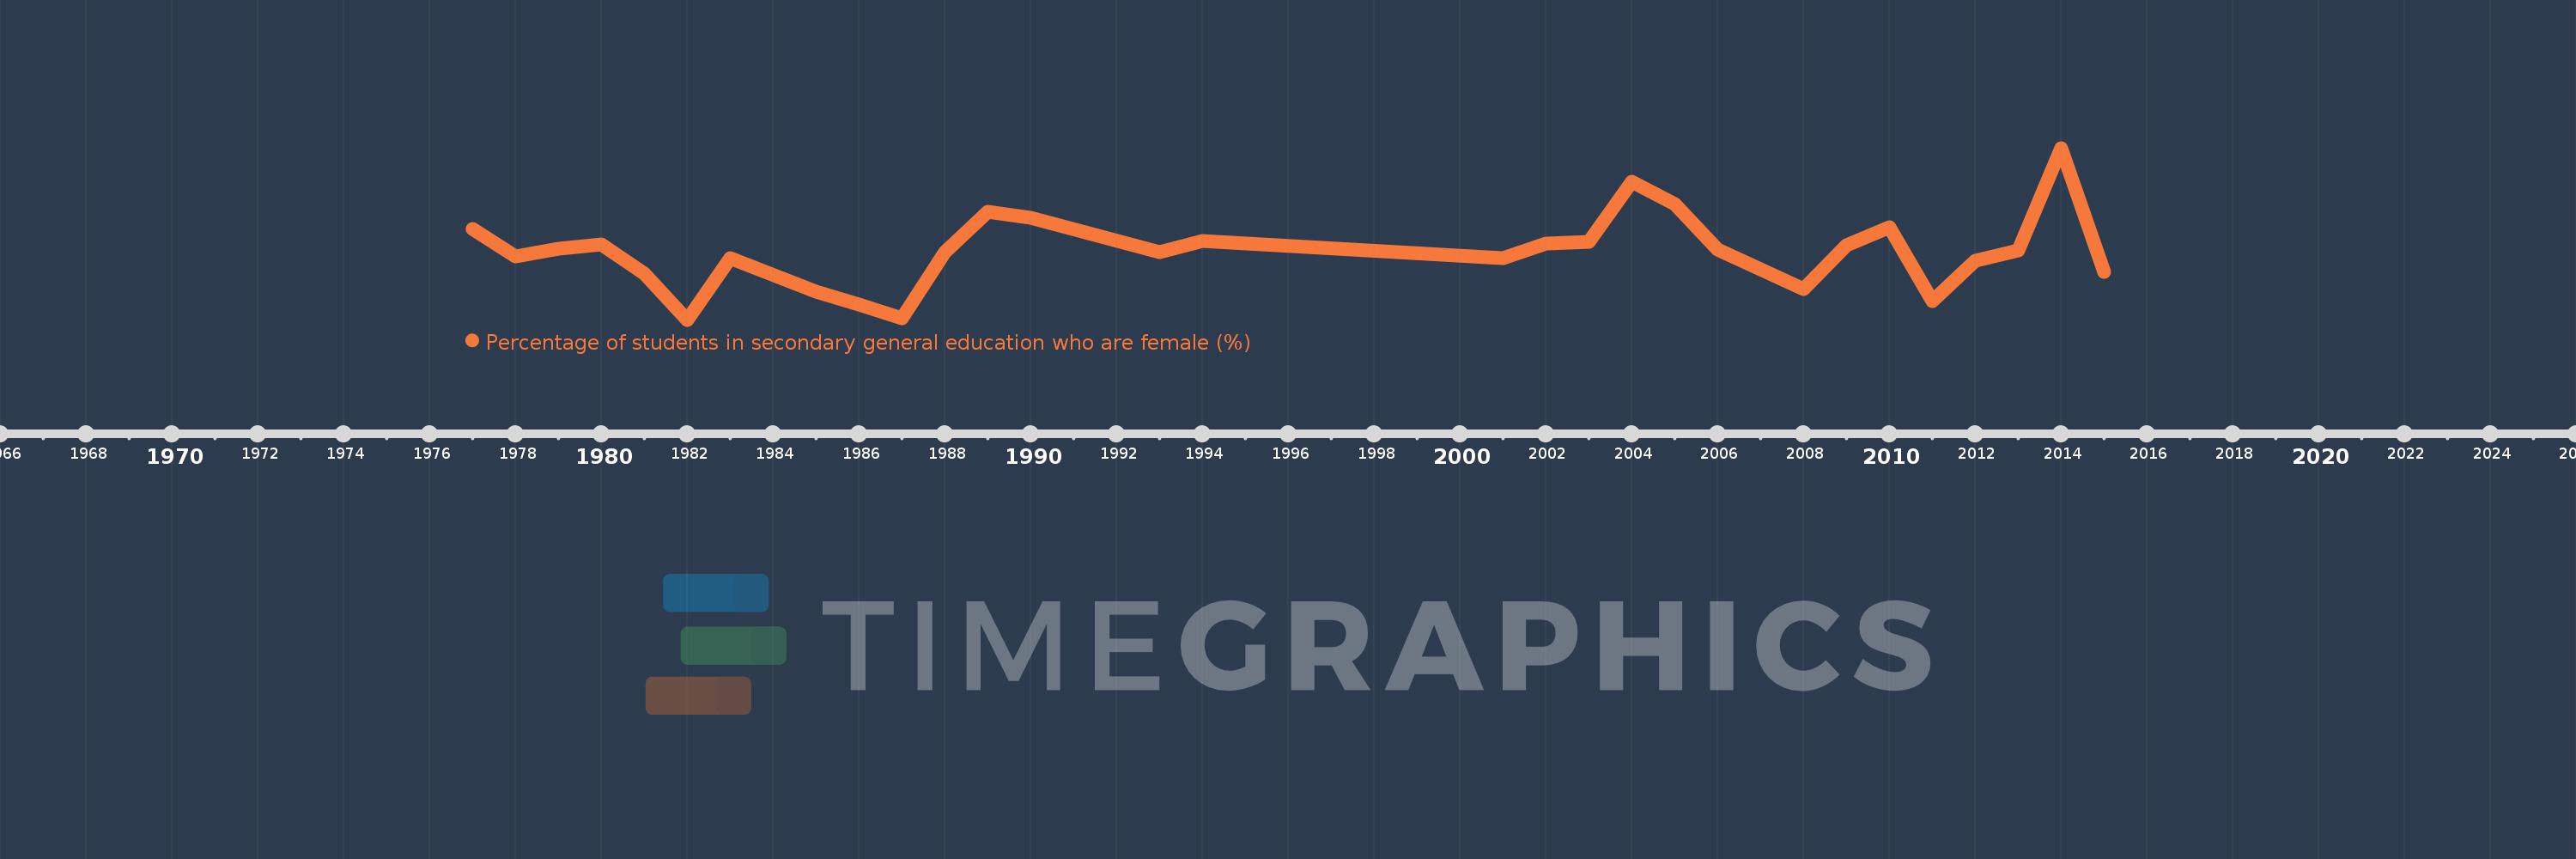
Percentage of students in secondary general education who are female (%)
2015,2014,2013,2012,2011,2010,2009,2008,2006,2005,2004,2003,2002,2001,1994,1993,1990,1989,1988,1987,1986,1985,1983,1982,1981,1980,1979,1978,1977
This statistics in other country:
AfghanistanAlbaniaAlgeriaAndorraAngolaAntigua and BarbudaArab WorldArgentinaArmeniaArubaAustraliaAustriaAzerbaijanBahamas, TheBahrainBangladeshBarbadosBelarusBelgiumBelizeBeninBermudaBhutanBoliviaBosnia and HerzegovinaBotswanaBrazilBritish Virgin IslandsBrunei DarussalamBulgariaBurkina FasoBurundiCabo VerdeCambodiaCameroonCanadaCaribbean small statesCayman IslandsCentral African RepublicCentral Europe and the BalticsChadChileChinaColombiaComorosCongo, Dem. Rep.Congo, Rep.Costa RicaCote d'IvoireCroatiaCubaCuracaoCyprusCzech RepublicDenmarkDjiboutiDominicaDominican RepublicEarly-demographic dividendEast Asia & PacificEast Asia & Pacific (excluding high income)East Asia & Pacific (IDA & IBRD countries)EcuadorEgypt, Arab Rep.El SalvadorEquatorial GuineaEritreaEstoniaEthiopiaEuro areaEurope & Central AsiaEurope & Central Asia (excluding high income)Europe & Central Asia (IDA & IBRD countries)European UnionFijiFinlandFragile and conflict affected situationsFranceGabonGambia, TheGeorgiaGermanyGhanaGibraltarGreeceGrenadaGuatemalaGuineaGuinea-BissauGuyanaHaitiHeavily indebted poor countries (HIPC)High incomeHondurasHong Kong SAR, ChinaHungaryIBRD onlyIcelandIDA & IBRD totalIDA blendIDA onlyIDA totalIndiaIndonesiaIran, Islamic Rep.IraqIrelandIsraelItalyJamaicaJapanJordanKazakhstanKenyaKiribatiKorea, Dem. People’s Rep.Korea, Rep.KuwaitKyrgyz RepublicLao PDRLate-demographic dividendLatin America & Caribbean Latin America & Caribbean (excluding high income)Latin America & the Caribbean (IDA & IBRD countries)LatviaLeast developed countries: UN classificationLebanonLesothoLiberiaLibyaLiechtensteinLithuaniaLow & middle incomeLow incomeLower middle incomeLuxembourgMacao SAR, ChinaMacedonia, FYRMadagascarMalawiMalaysiaMaldivesMaliMaltaMarshall IslandsMauritaniaMauritiusMexicoMicronesia, Fed. Sts.Middle East & North AfricaMiddle East & North Africa (excluding high income)Middle East & North Africa (IDA & IBRD countries)Middle incomeMoldovaMonacoMongoliaMontenegroMoroccoMozambiqueMyanmarNamibiaNauruNepalNetherlandsNew ZealandNicaraguaNigerNigeriaNorth AmericaNorwayOECD membersOmanOther small statesPacific island small statesPakistanPalauPanamaPapua New GuineaParaguayPeruPhilippinesPolandPortugalPost-demographic dividendPre-demographic dividendPuerto RicoQatarRomaniaRussian FederationRwandaSamoaSan MarinoSao Tome and PrincipeSaudi ArabiaSenegalSerbiaSeychellesSierra LeoneSingaporeSint Maarten (Dutch part)Slovak RepublicSloveniaSmall statesSolomon IslandsSomaliaSouth AfricaSouth AsiaSouth Asia (IDA & IBRD)South SudanSpainSri LankaSt. Kitts and NevisSt. LuciaSt. Vincent and the GrenadinesSub-Saharan Africa Sub-Saharan Africa (excluding high income)Sub-Saharan Africa (IDA & IBRD countries)SudanSurinameSwazilandSwedenSwitzerlandSyrian Arab RepublicTajikistanTanzaniaThailandTimor-LesteTogoTongaTrinidad and TobagoTunisiaTurkeyTurkmenistanTurks and Caicos IslandsTuvaluUgandaUkraineUnited Arab EmiratesUnited KingdomUnited StatesUpper middle incomeUruguayUzbekistanVanuatuVenezuela, RBVietnamWest Bank and GazaWorldYemen, Rep.ZambiaZimbabwe Timeline:
This timeline shows a graph from 1977 to 2015 of St. Kitts and Nevis. No data until 1976. Number of actual observations by date: 29.
Source name:
World Development Indicators
Source organization:
UNESCO Institute for Statistics
Categories, topics:
Education, Gender
Last updated:
apr 23, 2017
Indicators value changes by year
Minimum:
48.719
jan 1, 1982
Maximum:
53.548
jan 1, 2014
At the date of observation
Value
Absolute change
Change from previous value
jan 1, 1977
51.266
+51.266
0.0%
jan 1, 1978
50.503
-0.763
-1.49%
jan 1, 1979
50.721
+0.217
0.43%
jan 1, 1980
50.836
+0.116
0.23%
jan 1, 1981
50.022
-0.814
-1.6%
jan 1, 1982
48.719
-1.304
-2.61%
jan 1, 1983
50.461
+1.743
3.58%
jan 1, 1985
49.498
-0.964
-1.91%
jan 1, 1986
49.158
-0.34
-0.69%
jan 1, 1987
48.749
-0.409
-0.83%
jan 1, 1988
50.614
+1.865
3.83%
jan 1, 1989
51.756
+1.142
2.26%
jan 1, 1990
51.594
-0.162
-0.31%
jan 1, 1993
50.614
-0.98
-1.9%
jan 1, 1994
50.931
+0.317
0.63%
jan 1, 2001
50.461
-0.47
-0.92%
jan 1, 2002
50.855
+0.393
0.78%
jan 1, 2003
50.92
+0.065
0.13%
jan 1, 2004
52.611
+1.691
3.32%
jan 1, 2005
51.96
-0.651
-1.24%
jan 1, 2006
50.698
-1.262
-2.43%
jan 1, 2008
49.58
-1.118
-2.21%
jan 1, 2009
50.819
+1.239
2.5%
jan 1, 2010
51.311
+0.493
0.97%
jan 1, 2011
49.246
-2.066
-4.03%
jan 1, 2012
50.384
+1.138
2.31%
jan 1, 2013
50.667
+0.283
0.56%
jan 1, 2014
53.548
+2.881
5.69%
jan 1, 2015
50.069
-3.479
-6.5%
Ranking of countries by current statistics by years


Comments: