29
/
en
AIzaSyAYiBZKx7MnpbEhh9jyipgxe19OcubqV5w
April 1, 2024
249204
Sri Lanka
LKA
true
2
1
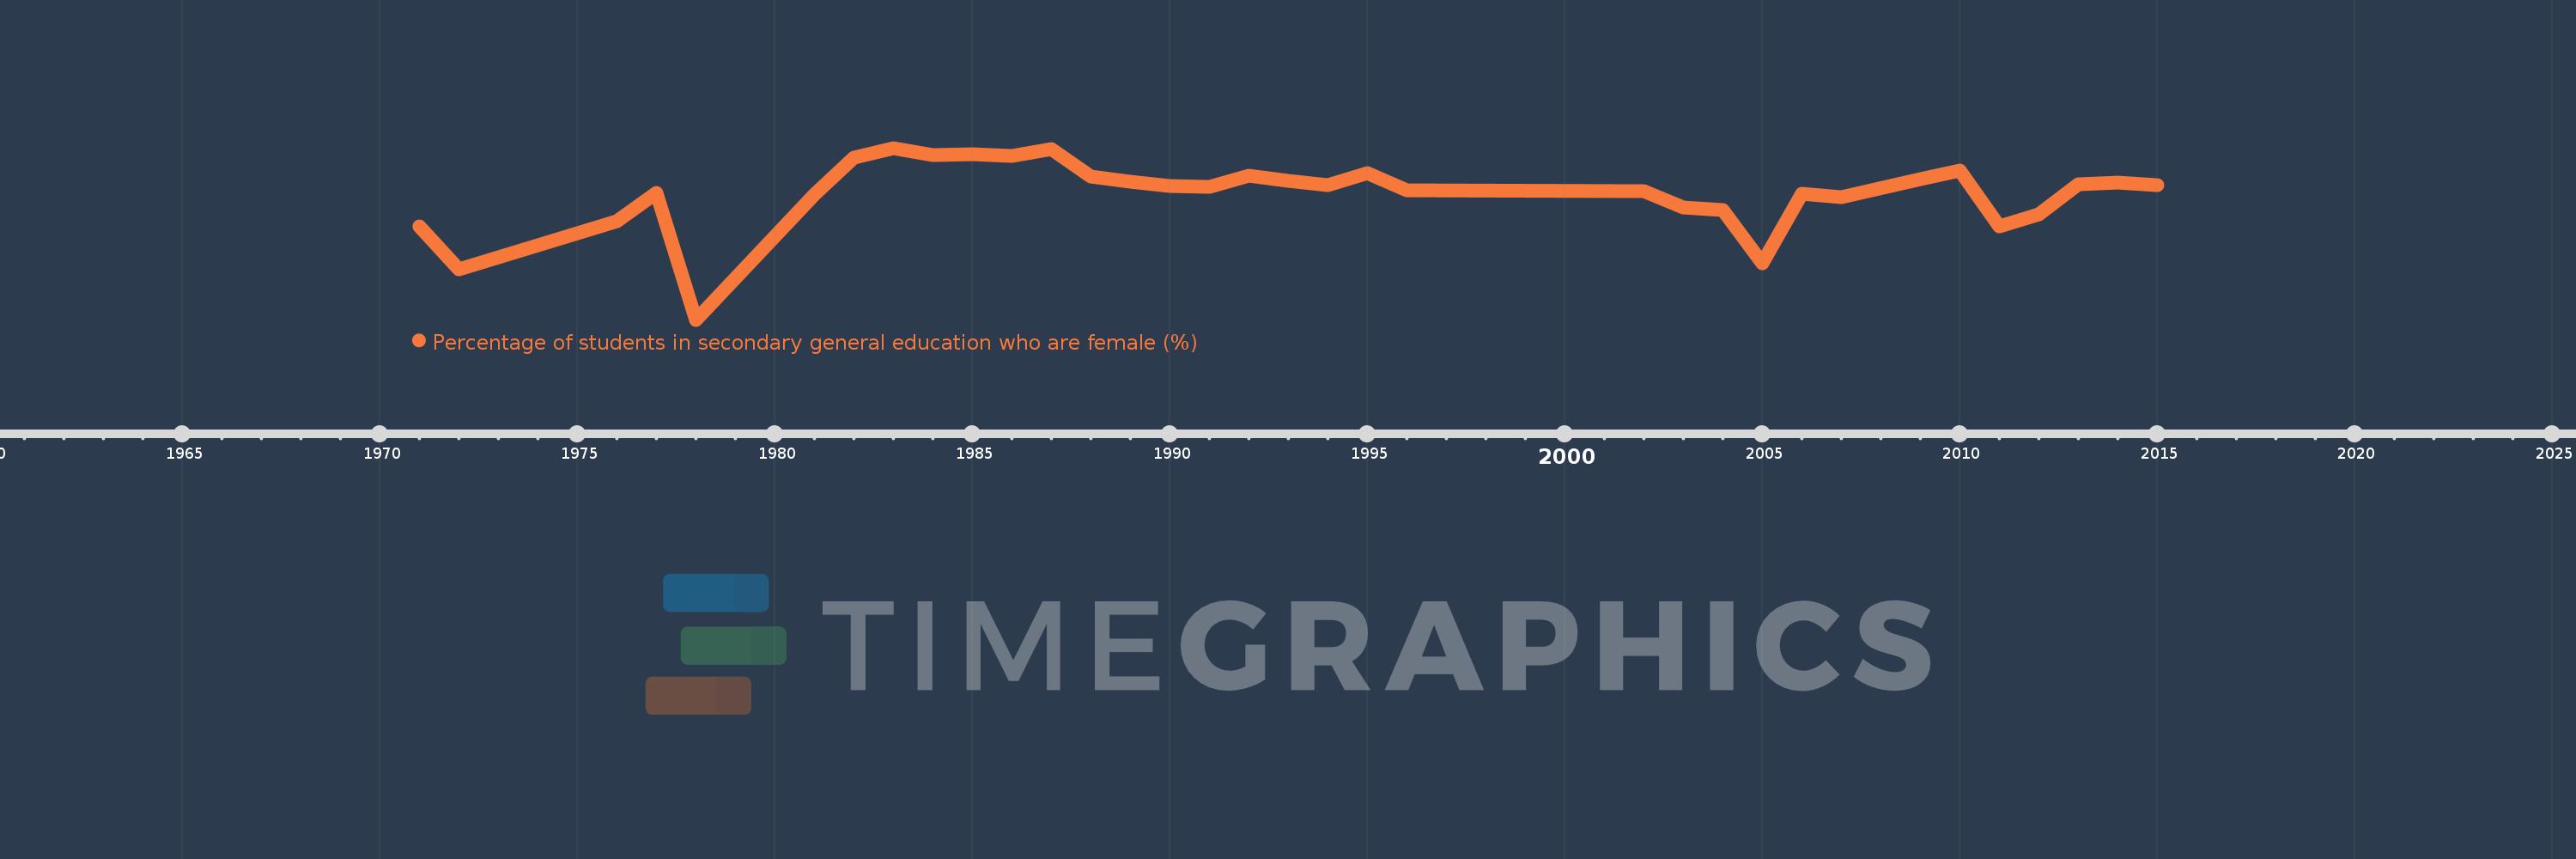
Percentage of students in secondary general education who are female (%)
2015,2014,2013,2012,2011,2010,2009,2007,2006,2005,2004,2003,2002,1996,1995,1994,1993,1992,1991,1990,1989,1988,1987,1986,1985,1984,1983,1982,1981,1978,1977,1976,1972,1971
This statistics in other country:
AfghanistanAlbaniaAlgeriaAndorraAngolaAntigua and BarbudaArab WorldArgentinaArmeniaArubaAustraliaAustriaAzerbaijanBahamas, TheBahrainBangladeshBarbadosBelarusBelgiumBelizeBeninBermudaBhutanBoliviaBosnia and HerzegovinaBotswanaBrazilBritish Virgin IslandsBrunei DarussalamBulgariaBurkina FasoBurundiCabo VerdeCambodiaCameroonCanadaCaribbean small statesCayman IslandsCentral African RepublicCentral Europe and the BalticsChadChileChinaColombiaComorosCongo, Dem. Rep.Congo, Rep.Costa RicaCote d'IvoireCroatiaCubaCuracaoCyprusCzech RepublicDenmarkDjiboutiDominicaDominican RepublicEarly-demographic dividendEast Asia & PacificEast Asia & Pacific (excluding high income)East Asia & Pacific (IDA & IBRD countries)EcuadorEgypt, Arab Rep.El SalvadorEquatorial GuineaEritreaEstoniaEthiopiaEuro areaEurope & Central AsiaEurope & Central Asia (excluding high income)Europe & Central Asia (IDA & IBRD countries)European UnionFijiFinlandFragile and conflict affected situationsFranceGabonGambia, TheGeorgiaGermanyGhanaGibraltarGreeceGrenadaGuatemalaGuineaGuinea-BissauGuyanaHaitiHeavily indebted poor countries (HIPC)High incomeHondurasHong Kong SAR, ChinaHungaryIBRD onlyIcelandIDA & IBRD totalIDA blendIDA onlyIDA totalIndiaIndonesiaIran, Islamic Rep.IraqIrelandIsraelItalyJamaicaJapanJordanKazakhstanKenyaKiribatiKorea, Dem. People’s Rep.Korea, Rep.KuwaitKyrgyz RepublicLao PDRLate-demographic dividendLatin America & Caribbean Latin America & Caribbean (excluding high income)Latin America & the Caribbean (IDA & IBRD countries)LatviaLeast developed countries: UN classificationLebanonLesothoLiberiaLibyaLiechtensteinLithuaniaLow & middle incomeLow incomeLower middle incomeLuxembourgMacao SAR, ChinaMacedonia, FYRMadagascarMalawiMalaysiaMaldivesMaliMaltaMarshall IslandsMauritaniaMauritiusMexicoMicronesia, Fed. Sts.Middle East & North AfricaMiddle East & North Africa (excluding high income)Middle East & North Africa (IDA & IBRD countries)Middle incomeMoldovaMonacoMongoliaMontenegroMoroccoMozambiqueMyanmarNamibiaNauruNepalNetherlandsNew ZealandNicaraguaNigerNigeriaNorth AmericaNorwayOECD membersOmanOther small statesPacific island small statesPakistanPalauPanamaPapua New GuineaParaguayPeruPhilippinesPolandPortugalPost-demographic dividendPre-demographic dividendPuerto RicoQatarRomaniaRussian FederationRwandaSamoaSan MarinoSao Tome and PrincipeSaudi ArabiaSenegalSerbiaSeychellesSierra LeoneSingaporeSint Maarten (Dutch part)Slovak RepublicSloveniaSmall statesSolomon IslandsSomaliaSouth AfricaSouth AsiaSouth Asia (IDA & IBRD)South SudanSpainSri LankaSt. Kitts and NevisSt. LuciaSt. Vincent and the GrenadinesSub-Saharan Africa Sub-Saharan Africa (excluding high income)Sub-Saharan Africa (IDA & IBRD countries)SudanSurinameSwazilandSwedenSwitzerlandSyrian Arab RepublicTajikistanTanzaniaThailandTimor-LesteTogoTongaTrinidad and TobagoTunisiaTurkeyTurkmenistanTurks and Caicos IslandsTuvaluUgandaUkraineUnited Arab EmiratesUnited KingdomUnited StatesUpper middle incomeUruguayUzbekistanVanuatuVenezuela, RBVietnamWest Bank and GazaWorldYemen, Rep.ZambiaZimbabwe Timeline:
This timeline shows a graph from 1971 to 2015 of Sri Lanka. No data until 1970. Number of actual observations by date: 34.
Source name:
World Development Indicators
Source organization:
UNESCO Institute for Statistics
Categories, topics:
Education, Gender
Last updated:
apr 23, 2017
Indicators value changes by year
Minimum:
48.195
jan 1, 1978
Maximum:
51.984
jan 1, 1983
At the date of observation
Value
Absolute change
Change from previous value
jan 1, 1971
50.262
+50.262
0.0%
jan 1, 1972
49.309
-0.953
-1.9%
jan 1, 1976
50.367
+1.057
2.14%
jan 1, 1977
50.989
+0.622
1.24%
jan 1, 1978
48.195
-2.794
-5.48%
jan 1, 1981
50.957
+2.763
5.73%
jan 1, 1982
51.771
+0.814
1.6%
jan 1, 1983
51.984
+0.213
0.41%
jan 1, 1984
51.822
-0.163
-0.31%
jan 1, 1985
51.848
+0.026
0.05%
jan 1, 1986
51.801
-0.047
-0.09%
jan 1, 1987
51.958
+0.158
0.3%
jan 1, 1988
51.36
-0.599
-1.15%
jan 1, 1989
51.242
-0.117
-0.23%
jan 1, 1990
51.136
-0.107
-0.21%
jan 1, 1991
51.128
-0.008
-0.02%
jan 1, 1992
51.377
+0.25
0.49%
jan 1, 1993
51.25
-0.128
-0.25%
jan 1, 1994
51.17
-0.08
-0.16%
jan 1, 1995
51.424
+0.255
0.5%
jan 1, 1996
51.052
-0.372
-0.72%
jan 1, 2002
51.037
-0.015
-0.03%
jan 1, 2003
50.673
-0.365
-0.71%
jan 1, 2004
50.613
-0.06
-0.12%
jan 1, 2005
49.449
-1.165
-2.3%
jan 1, 2006
50.97
+1.521
3.08%
jan 1, 2007
50.893
-0.077
-0.15%
jan 1, 2009
51.303
+0.411
0.81%
jan 1, 2010
51.479
+0.176
0.34%
jan 1, 2011
50.258
-1.221
-2.37%
jan 1, 2012
50.527
+0.27
0.54%
jan 1, 2013
51.18
+0.653
1.29%
jan 1, 2014
51.22
+0.04
0.08%
jan 1, 2015
51.155
-0.066
-0.13%
Ranking of countries by current statistics by years


Comments: