29
/
en
AIzaSyAYiBZKx7MnpbEhh9jyipgxe19OcubqV5w
April 1, 2024
35278
Heavily indebted poor countries (HIPC)
HPC
false
2
1
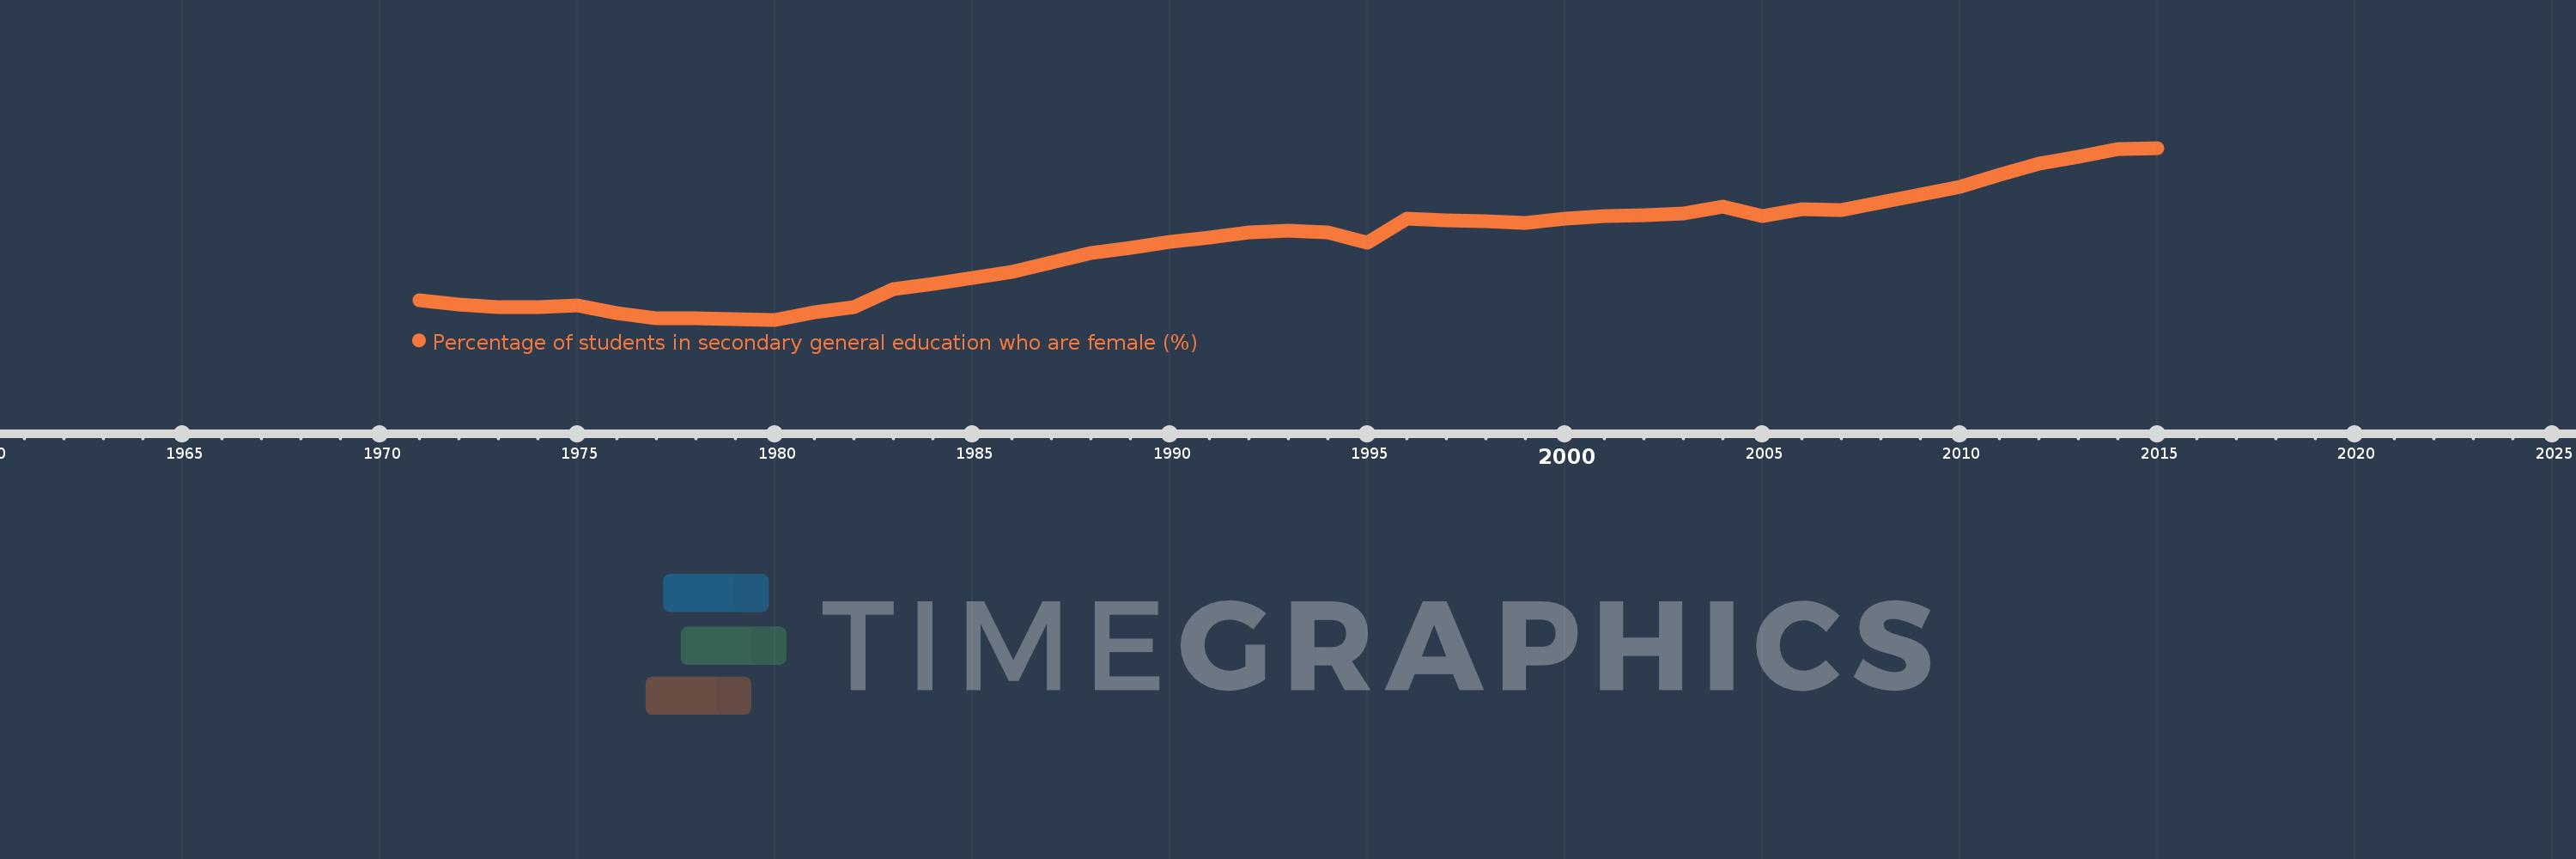
Percentage of students in secondary general education who are female (%)
2015,2014,2013,2012,2011,2010,2009,2008,2007,2006,2005,2004,2003,2002,2001,2000,1999,1998,1997,1996,1995,1994,1993,1992,1991,1990,1989,1988,1987,1986,1985,1984,1983,1982,1981,1980,1979,1978,1977,1976,1975,1974,1973,1972,1971
This statistics in other country:
AfghanistanAlbaniaAlgeriaAndorraAngolaAntigua and BarbudaArab WorldArgentinaArmeniaArubaAustraliaAustriaAzerbaijanBahamas, TheBahrainBangladeshBarbadosBelarusBelgiumBelizeBeninBermudaBhutanBoliviaBosnia and HerzegovinaBotswanaBrazilBritish Virgin IslandsBrunei DarussalamBulgariaBurkina FasoBurundiCabo VerdeCambodiaCameroonCanadaCaribbean small statesCayman IslandsCentral African RepublicCentral Europe and the BalticsChadChileChinaColombiaComorosCongo, Dem. Rep.Congo, Rep.Costa RicaCote d'IvoireCroatiaCubaCuracaoCyprusCzech RepublicDenmarkDjiboutiDominicaDominican RepublicEarly-demographic dividendEast Asia & PacificEast Asia & Pacific (excluding high income)East Asia & Pacific (IDA & IBRD countries)EcuadorEgypt, Arab Rep.El SalvadorEquatorial GuineaEritreaEstoniaEthiopiaEuro areaEurope & Central AsiaEurope & Central Asia (excluding high income)Europe & Central Asia (IDA & IBRD countries)European UnionFijiFinlandFragile and conflict affected situationsFranceGabonGambia, TheGeorgiaGermanyGhanaGibraltarGreeceGrenadaGuatemalaGuineaGuinea-BissauGuyanaHaitiHeavily indebted poor countries (HIPC)High incomeHondurasHong Kong SAR, ChinaHungaryIBRD onlyIcelandIDA & IBRD totalIDA blendIDA onlyIDA totalIndiaIndonesiaIran, Islamic Rep.IraqIrelandIsraelItalyJamaicaJapanJordanKazakhstanKenyaKiribatiKorea, Dem. People’s Rep.Korea, Rep.KuwaitKyrgyz RepublicLao PDRLate-demographic dividendLatin America & Caribbean Latin America & Caribbean (excluding high income)Latin America & the Caribbean (IDA & IBRD countries)LatviaLeast developed countries: UN classificationLebanonLesothoLiberiaLibyaLiechtensteinLithuaniaLow & middle incomeLow incomeLower middle incomeLuxembourgMacao SAR, ChinaMacedonia, FYRMadagascarMalawiMalaysiaMaldivesMaliMaltaMarshall IslandsMauritaniaMauritiusMexicoMicronesia, Fed. Sts.Middle East & North AfricaMiddle East & North Africa (excluding high income)Middle East & North Africa (IDA & IBRD countries)Middle incomeMoldovaMonacoMongoliaMontenegroMoroccoMozambiqueMyanmarNamibiaNauruNepalNetherlandsNew ZealandNicaraguaNigerNigeriaNorth AmericaNorwayOECD membersOmanOther small statesPacific island small statesPakistanPalauPanamaPapua New GuineaParaguayPeruPhilippinesPolandPortugalPost-demographic dividendPre-demographic dividendPuerto RicoQatarRomaniaRussian FederationRwandaSamoaSan MarinoSao Tome and PrincipeSaudi ArabiaSenegalSerbiaSeychellesSierra LeoneSingaporeSint Maarten (Dutch part)Slovak RepublicSloveniaSmall statesSolomon IslandsSomaliaSouth AfricaSouth AsiaSouth Asia (IDA & IBRD)South SudanSpainSri LankaSt. Kitts and NevisSt. LuciaSt. Vincent and the GrenadinesSub-Saharan Africa Sub-Saharan Africa (excluding high income)Sub-Saharan Africa (IDA & IBRD countries)SudanSurinameSwazilandSwedenSwitzerlandSyrian Arab RepublicTajikistanTanzaniaThailandTimor-LesteTogoTongaTrinidad and TobagoTunisiaTurkeyTurkmenistanTurks and Caicos IslandsTuvaluUgandaUkraineUnited Arab EmiratesUnited KingdomUnited StatesUpper middle incomeUruguayUzbekistanVanuatuVenezuela, RBVietnamWest Bank and GazaWorldYemen, Rep.ZambiaZimbabwe Timeline:
This timeline shows a graph from 1971 to 2015 of Heavily indebted poor countries (HIPC). No data until 1970. Number of actual observations by date: 45.
Source name:
World Development Indicators
Source organization:
UNESCO Institute for Statistics
Categories, topics:
Education, Gender
Last updated:
apr 23, 2017
Indicators value changes by year
Minimum:
35.311
jan 1, 1980
Maximum:
44.616
jan 1, 2015
At the date of observation
Value
Absolute change
Change from previous value
jan 1, 1971
36.381
+36.381
0.0%
jan 1, 1972
36.155
-0.226
-0.62%
jan 1, 1973
36.003
-0.152
-0.42%
jan 1, 1974
36.007
+0.004
0.01%
jan 1, 1975
36.09
+0.083
0.23%
jan 1, 1976
35.659
-0.431
-1.19%
jan 1, 1977
35.411
-0.248
-0.7%
jan 1, 1978
35.402
-0.009
-0.03%
jan 1, 1979
35.356
-0.046
-0.13%
jan 1, 1980
35.311
-0.045
-0.13%
jan 1, 1981
35.707
+0.396
1.12%
jan 1, 1982
36.003
+0.296
0.83%
jan 1, 1983
36.983
+0.98
2.72%
jan 1, 1984
37.257
+0.275
0.74%
jan 1, 1985
37.575
+0.317
0.85%
jan 1, 1986
37.884
+0.31
0.82%
jan 1, 1987
38.425
+0.541
1.43%
jan 1, 1988
38.907
+0.483
1.26%
jan 1, 1989
39.182
+0.274
0.71%
jan 1, 1990
39.529
+0.347
0.89%
jan 1, 1991
39.784
+0.255
0.64%
jan 1, 1992
40.063
+0.279
0.7%
jan 1, 1993
40.135
+0.072
0.18%
jan 1, 1994
40.034
-0.101
-0.25%
jan 1, 1995
39.503
-0.531
-1.33%
jan 1, 1996
40.765
+1.261
3.19%
jan 1, 1997
40.698
-0.067
-0.16%
jan 1, 1998
40.669
-0.029
-0.07%
jan 1, 1999
40.562
-0.107
-0.26%
jan 1, 2000
40.779
+0.217
0.53%
jan 1, 2001
40.938
+0.159
0.39%
jan 1, 2002
40.974
+0.036
0.09%
jan 1, 2003
41.082
+0.108
0.26%
jan 1, 2004
41.445
+0.363
0.88%
jan 1, 2005
40.936
-0.509
-1.23%
jan 1, 2006
41.317
+0.381
0.93%
jan 1, 2007
41.264
-0.053
-0.13%
jan 1, 2008
41.69
+0.427
1.03%
jan 1, 2009
42.099
+0.409
0.98%
jan 1, 2010
42.526
+0.427
1.02%
jan 1, 2011
43.149
+0.623
1.46%
jan 1, 2012
43.774
+0.625
1.45%
jan 1, 2013
44.121
+0.347
0.79%
jan 1, 2014
44.551
+0.43
0.97%
jan 1, 2015
44.616
+0.065
0.15%
Ranking of countries by current statistics by years


Comments: