29
/
en
AIzaSyAYiBZKx7MnpbEhh9jyipgxe19OcubqV5w
April 1, 2024
216908
Pakistan
PAK
true
2
1
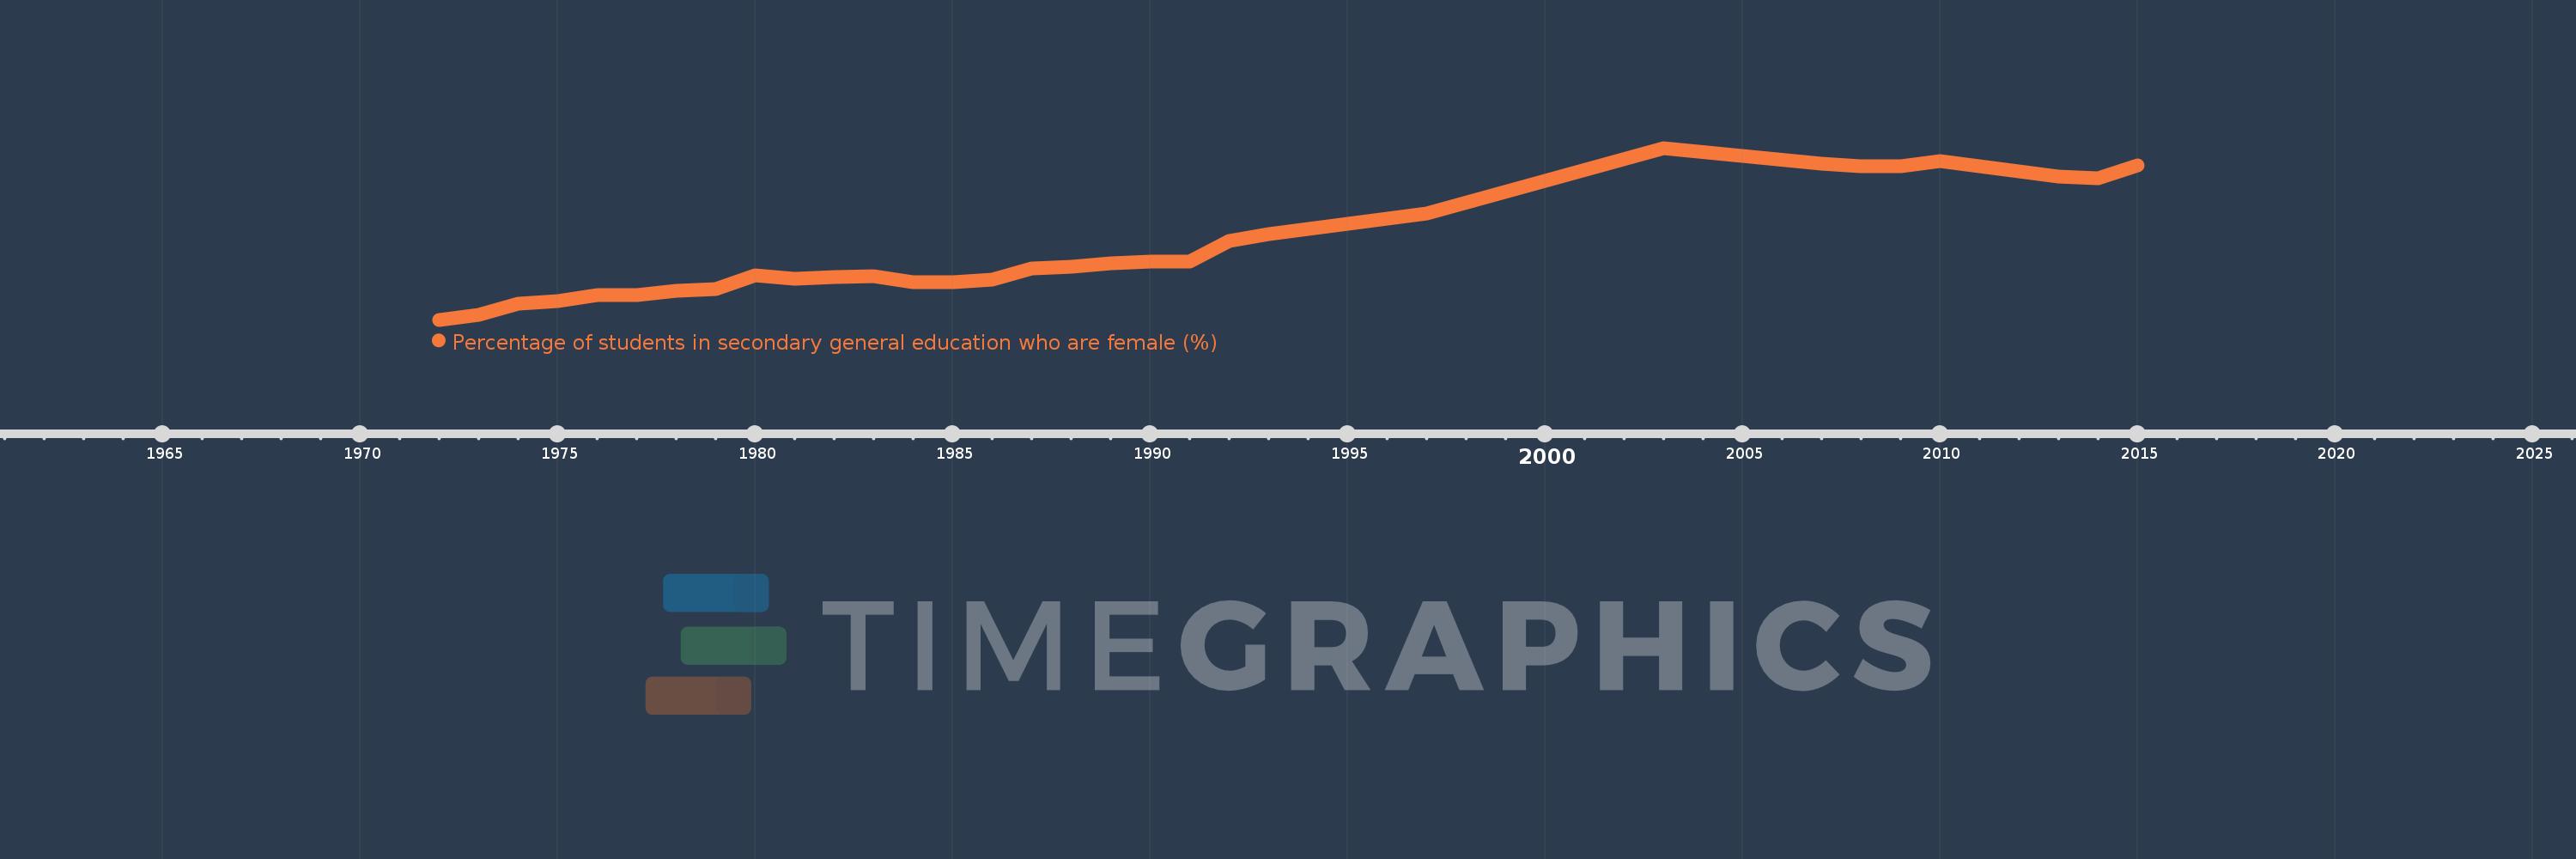
Percentage of students in secondary general education who are female (%)
2015,2014,2013,2012,2011,2010,2009,2008,2007,2003,1997,1993,1992,1991,1990,1989,1988,1987,1986,1985,1984,1983,1982,1981,1980,1979,1978,1977,1976,1975,1974,1973,1972
This statistics in other country:
AfghanistanAlbaniaAlgeriaAndorraAngolaAntigua and BarbudaArab WorldArgentinaArmeniaArubaAustraliaAustriaAzerbaijanBahamas, TheBahrainBangladeshBarbadosBelarusBelgiumBelizeBeninBermudaBhutanBoliviaBosnia and HerzegovinaBotswanaBrazilBritish Virgin IslandsBrunei DarussalamBulgariaBurkina FasoBurundiCabo VerdeCambodiaCameroonCanadaCaribbean small statesCayman IslandsCentral African RepublicCentral Europe and the BalticsChadChileChinaColombiaComorosCongo, Dem. Rep.Congo, Rep.Costa RicaCote d'IvoireCroatiaCubaCuracaoCyprusCzech RepublicDenmarkDjiboutiDominicaDominican RepublicEarly-demographic dividendEast Asia & PacificEast Asia & Pacific (excluding high income)East Asia & Pacific (IDA & IBRD countries)EcuadorEgypt, Arab Rep.El SalvadorEquatorial GuineaEritreaEstoniaEthiopiaEuro areaEurope & Central AsiaEurope & Central Asia (excluding high income)Europe & Central Asia (IDA & IBRD countries)European UnionFijiFinlandFragile and conflict affected situationsFranceGabonGambia, TheGeorgiaGermanyGhanaGibraltarGreeceGrenadaGuatemalaGuineaGuinea-BissauGuyanaHaitiHeavily indebted poor countries (HIPC)High incomeHondurasHong Kong SAR, ChinaHungaryIBRD onlyIcelandIDA & IBRD totalIDA blendIDA onlyIDA totalIndiaIndonesiaIran, Islamic Rep.IraqIrelandIsraelItalyJamaicaJapanJordanKazakhstanKenyaKiribatiKorea, Dem. People’s Rep.Korea, Rep.KuwaitKyrgyz RepublicLao PDRLate-demographic dividendLatin America & Caribbean Latin America & Caribbean (excluding high income)Latin America & the Caribbean (IDA & IBRD countries)LatviaLeast developed countries: UN classificationLebanonLesothoLiberiaLibyaLiechtensteinLithuaniaLow & middle incomeLow incomeLower middle incomeLuxembourgMacao SAR, ChinaMacedonia, FYRMadagascarMalawiMalaysiaMaldivesMaliMaltaMarshall IslandsMauritaniaMauritiusMexicoMicronesia, Fed. Sts.Middle East & North AfricaMiddle East & North Africa (excluding high income)Middle East & North Africa (IDA & IBRD countries)Middle incomeMoldovaMonacoMongoliaMontenegroMoroccoMozambiqueMyanmarNamibiaNauruNepalNetherlandsNew ZealandNicaraguaNigerNigeriaNorth AmericaNorwayOECD membersOmanOther small statesPacific island small statesPakistanPalauPanamaPapua New GuineaParaguayPeruPhilippinesPolandPortugalPost-demographic dividendPre-demographic dividendPuerto RicoQatarRomaniaRussian FederationRwandaSamoaSan MarinoSao Tome and PrincipeSaudi ArabiaSenegalSerbiaSeychellesSierra LeoneSingaporeSint Maarten (Dutch part)Slovak RepublicSloveniaSmall statesSolomon IslandsSomaliaSouth AfricaSouth AsiaSouth Asia (IDA & IBRD)South SudanSpainSri LankaSt. Kitts and NevisSt. LuciaSt. Vincent and the GrenadinesSub-Saharan Africa Sub-Saharan Africa (excluding high income)Sub-Saharan Africa (IDA & IBRD countries)SudanSurinameSwazilandSwedenSwitzerlandSyrian Arab RepublicTajikistanTanzaniaThailandTimor-LesteTogoTongaTrinidad and TobagoTunisiaTurkeyTurkmenistanTurks and Caicos IslandsTuvaluUgandaUkraineUnited Arab EmiratesUnited KingdomUnited StatesUpper middle incomeUruguayUzbekistanVanuatuVenezuela, RBVietnamWest Bank and GazaWorldYemen, Rep.ZambiaZimbabwe Timeline:
This timeline shows a graph from 1972 to 2015 of Pakistan. No data until 1971. Number of actual observations by date: 33.
Source name:
World Development Indicators
Source organization:
UNESCO Institute for Statistics
Categories, topics:
Education, Gender
Last updated:
apr 23, 2017
Indicators value changes by year
Minimum:
19.682
jan 1, 1972
Maximum:
44.778
jan 1, 2003
At the date of observation
Value
Absolute change
Change from previous value
jan 1, 1972
19.682
+19.682
0.0%
jan 1, 1973
20.449
+0.767
3.9%
jan 1, 1974
22.07
+1.621
7.93%
jan 1, 1975
22.388
+0.318
1.44%
jan 1, 1976
23.315
+0.927
4.14%
jan 1, 1977
23.262
-0.053
-0.23%
jan 1, 1978
23.881
+0.619
2.66%
jan 1, 1979
24.159
+0.278
1.16%
jan 1, 1980
26.123
+1.964
8.13%
jan 1, 1981
25.61
-0.513
-1.96%
jan 1, 1982
25.939
+0.328
1.28%
jan 1, 1983
26.039
+0.101
0.39%
jan 1, 1984
25.127
-0.913
-3.5%
jan 1, 1985
25.199
+0.072
0.29%
jan 1, 1986
25.601
+0.401
1.59%
jan 1, 1987
27.146
+1.545
6.04%
jan 1, 1988
27.405
+0.259
0.96%
jan 1, 1989
27.908
+0.503
1.84%
jan 1, 1990
28.135
+0.227
0.81%
jan 1, 1991
28.174
+0.04
0.14%
jan 1, 1992
31.163
+2.989
10.61%
jan 1, 1993
32.191
+1.028
3.3%
jan 1, 1997
35.206
+3.014
9.36%
jan 1, 2003
44.778
+9.572
27.19%
jan 1, 2007
42.46
-2.318
-5.18%
jan 1, 2008
42.067
-0.393
-0.93%
jan 1, 2009
42.045
-0.023
-0.05%
jan 1, 2010
42.864
+0.819
1.95%
jan 1, 2011
42.056
-0.808
-1.89%
jan 1, 2012
41.302
-0.753
-1.79%
jan 1, 2013
40.587
-0.715
-1.73%
jan 1, 2014
40.386
-0.201
-0.5%
jan 1, 2015
42.241
+1.855
4.59%
Ranking of countries by current statistics by years


Comments: