29
/
en
AIzaSyAYiBZKx7MnpbEhh9jyipgxe19OcubqV5w
April 1, 2024
255597
Swaziland
SWZ
true
2
1
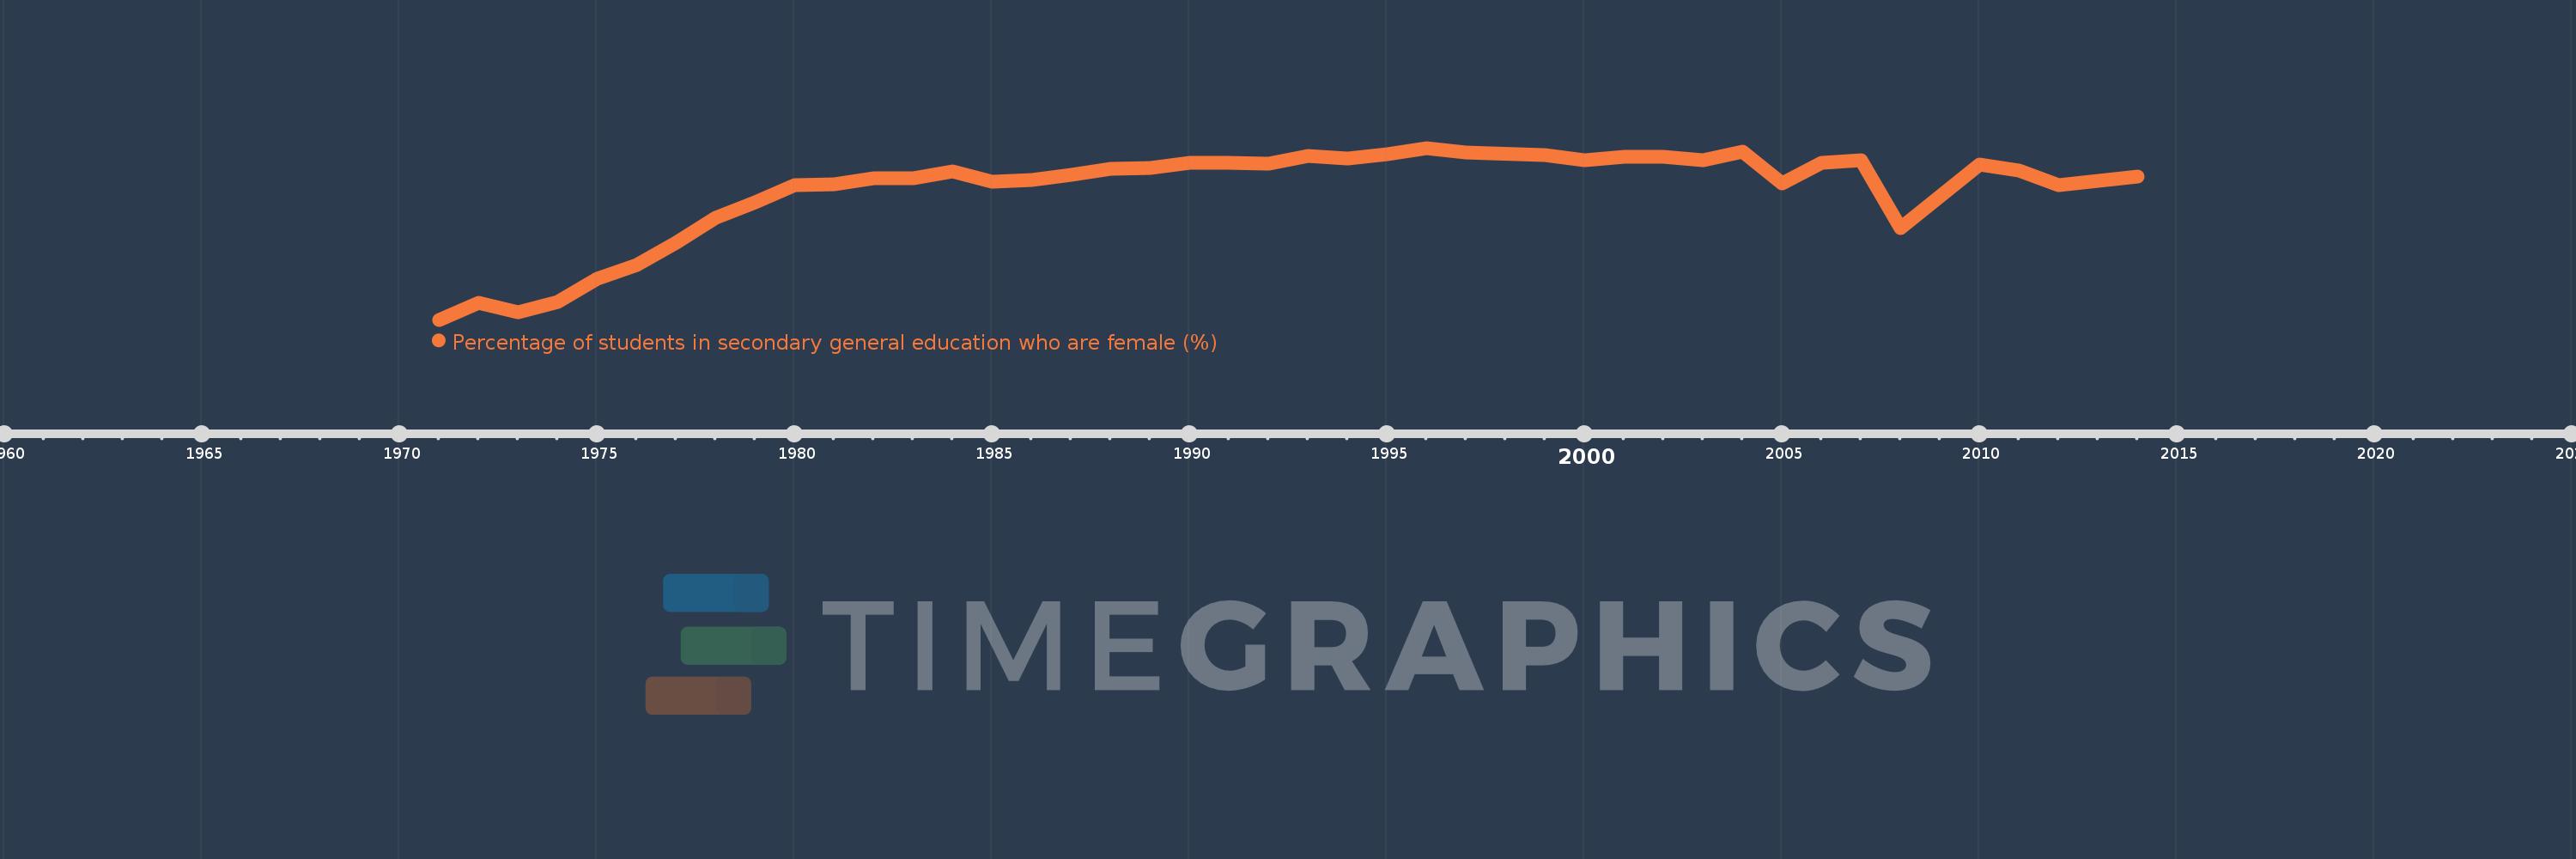
Percentage of students in secondary general education who are female (%)
2014,2012,2011,2010,2008,2007,2006,2005,2004,2003,2002,2001,2000,1999,1997,1996,1995,1994,1993,1992,1991,1990,1989,1988,1987,1986,1985,1984,1983,1982,1981,1980,1979,1978,1977,1976,1975,1974,1973,1972,1971
This statistics in other country:
AfghanistanAlbaniaAlgeriaAndorraAngolaAntigua and BarbudaArab WorldArgentinaArmeniaArubaAustraliaAustriaAzerbaijanBahamas, TheBahrainBangladeshBarbadosBelarusBelgiumBelizeBeninBermudaBhutanBoliviaBosnia and HerzegovinaBotswanaBrazilBritish Virgin IslandsBrunei DarussalamBulgariaBurkina FasoBurundiCabo VerdeCambodiaCameroonCanadaCaribbean small statesCayman IslandsCentral African RepublicCentral Europe and the BalticsChadChileChinaColombiaComorosCongo, Dem. Rep.Congo, Rep.Costa RicaCote d'IvoireCroatiaCubaCuracaoCyprusCzech RepublicDenmarkDjiboutiDominicaDominican RepublicEarly-demographic dividendEast Asia & PacificEast Asia & Pacific (excluding high income)East Asia & Pacific (IDA & IBRD countries)EcuadorEgypt, Arab Rep.El SalvadorEquatorial GuineaEritreaEstoniaEthiopiaEuro areaEurope & Central AsiaEurope & Central Asia (excluding high income)Europe & Central Asia (IDA & IBRD countries)European UnionFijiFinlandFragile and conflict affected situationsFranceGabonGambia, TheGeorgiaGermanyGhanaGibraltarGreeceGrenadaGuatemalaGuineaGuinea-BissauGuyanaHaitiHeavily indebted poor countries (HIPC)High incomeHondurasHong Kong SAR, ChinaHungaryIBRD onlyIcelandIDA & IBRD totalIDA blendIDA onlyIDA totalIndiaIndonesiaIran, Islamic Rep.IraqIrelandIsraelItalyJamaicaJapanJordanKazakhstanKenyaKiribatiKorea, Dem. People’s Rep.Korea, Rep.KuwaitKyrgyz RepublicLao PDRLate-demographic dividendLatin America & Caribbean Latin America & Caribbean (excluding high income)Latin America & the Caribbean (IDA & IBRD countries)LatviaLeast developed countries: UN classificationLebanonLesothoLiberiaLibyaLiechtensteinLithuaniaLow & middle incomeLow incomeLower middle incomeLuxembourgMacao SAR, ChinaMacedonia, FYRMadagascarMalawiMalaysiaMaldivesMaliMaltaMarshall IslandsMauritaniaMauritiusMexicoMicronesia, Fed. Sts.Middle East & North AfricaMiddle East & North Africa (excluding high income)Middle East & North Africa (IDA & IBRD countries)Middle incomeMoldovaMonacoMongoliaMontenegroMoroccoMozambiqueMyanmarNamibiaNauruNepalNetherlandsNew ZealandNicaraguaNigerNigeriaNorth AmericaNorwayOECD membersOmanOther small statesPacific island small statesPakistanPalauPanamaPapua New GuineaParaguayPeruPhilippinesPolandPortugalPost-demographic dividendPre-demographic dividendPuerto RicoQatarRomaniaRussian FederationRwandaSamoaSan MarinoSao Tome and PrincipeSaudi ArabiaSenegalSerbiaSeychellesSierra LeoneSingaporeSint Maarten (Dutch part)Slovak RepublicSloveniaSmall statesSolomon IslandsSomaliaSouth AfricaSouth AsiaSouth Asia (IDA & IBRD)South SudanSpainSri LankaSt. Kitts and NevisSt. LuciaSt. Vincent and the GrenadinesSub-Saharan Africa Sub-Saharan Africa (excluding high income)Sub-Saharan Africa (IDA & IBRD countries)SudanSurinameSwazilandSwedenSwitzerlandSyrian Arab RepublicTajikistanTanzaniaThailandTimor-LesteTogoTongaTrinidad and TobagoTunisiaTurkeyTurkmenistanTurks and Caicos IslandsTuvaluUgandaUkraineUnited Arab EmiratesUnited KingdomUnited StatesUpper middle incomeUruguayUzbekistanVanuatuVenezuela, RBVietnamWest Bank and GazaWorldYemen, Rep.ZambiaZimbabwe Timeline:
This timeline shows a graph from 1971 to 2014 of Swaziland. No data until 1970. Number of actual observations by date: 41.
Source name:
World Development Indicators
Source organization:
UNESCO Institute for Statistics
Categories, topics:
Education, Gender
Last updated:
apr 23, 2017
Indicators value changes by year
Maximum:
50.603
jan 1, 1996
At the date of observation
Value
Absolute change
Change from previous value
jan 1, 1971
43.08
+43.08
0.0%
jan 1, 1972
43.817
+0.738
1.71%
jan 1, 1973
43.404
-0.413
-0.94%
jan 1, 1974
43.872
+0.468
1.08%
jan 1, 1975
44.871
+0.999
2.28%
jan 1, 1976
45.467
+0.596
1.33%
jan 1, 1977
46.459
+0.992
2.18%
jan 1, 1978
47.544
+1.085
2.34%
jan 1, 1979
48.227
+0.683
1.44%
jan 1, 1980
48.993
+0.766
1.59%
jan 1, 1981
49.013
+0.02
0.04%
jan 1, 1982
49.279
+0.266
0.54%
jan 1, 1983
49.269
-0.01
-0.02%
jan 1, 1984
49.592
+0.323
0.66%
jan 1, 1985
49.121
-0.471
-0.95%
jan 1, 1986
49.198
+0.077
0.16%
jan 1, 1987
49.431
+0.233
0.47%
jan 1, 1988
49.675
+0.244
0.49%
jan 1, 1989
49.734
+0.058
0.12%
jan 1, 1990
49.958
+0.225
0.45%
jan 1, 1991
49.968
+0.01
0.02%
jan 1, 1992
49.904
-0.065
-0.13%
jan 1, 1993
50.27
+0.366
0.73%
jan 1, 1994
50.157
-0.113
-0.22%
jan 1, 1995
50.34
+0.182
0.36%
jan 1, 1996
50.603
+0.264
0.52%
jan 1, 1997
50.398
-0.206
-0.41%
jan 1, 1999
50.304
-0.094
-0.19%
jan 1, 2000
50.08
-0.224
-0.44%
jan 1, 2001
50.215
+0.135
0.27%
jan 1, 2002
50.22
+0.004
0.01%
jan 1, 2003
50.068
-0.151
-0.3%
jan 1, 2004
50.449
+0.38
0.76%
jan 1, 2005
49.065
-1.384
-2.74%
jan 1, 2006
49.955
+0.89
1.81%
jan 1, 2007
50.079
+0.124
0.25%
jan 1, 2008
47.082
-2.997
-5.98%
jan 1, 2010
49.86
+2.778
5.9%
jan 1, 2011
49.616
-0.244
-0.49%
jan 1, 2012
48.975
-0.641
-1.29%
jan 1, 2014
49.367
+0.391
0.8%
Ranking of countries by current statistics by years


Comments: