29
/
en
AIzaSyAYiBZKx7MnpbEhh9jyipgxe19OcubqV5w
April 1, 2024
156473
Indonesia
IDN
true
2
1
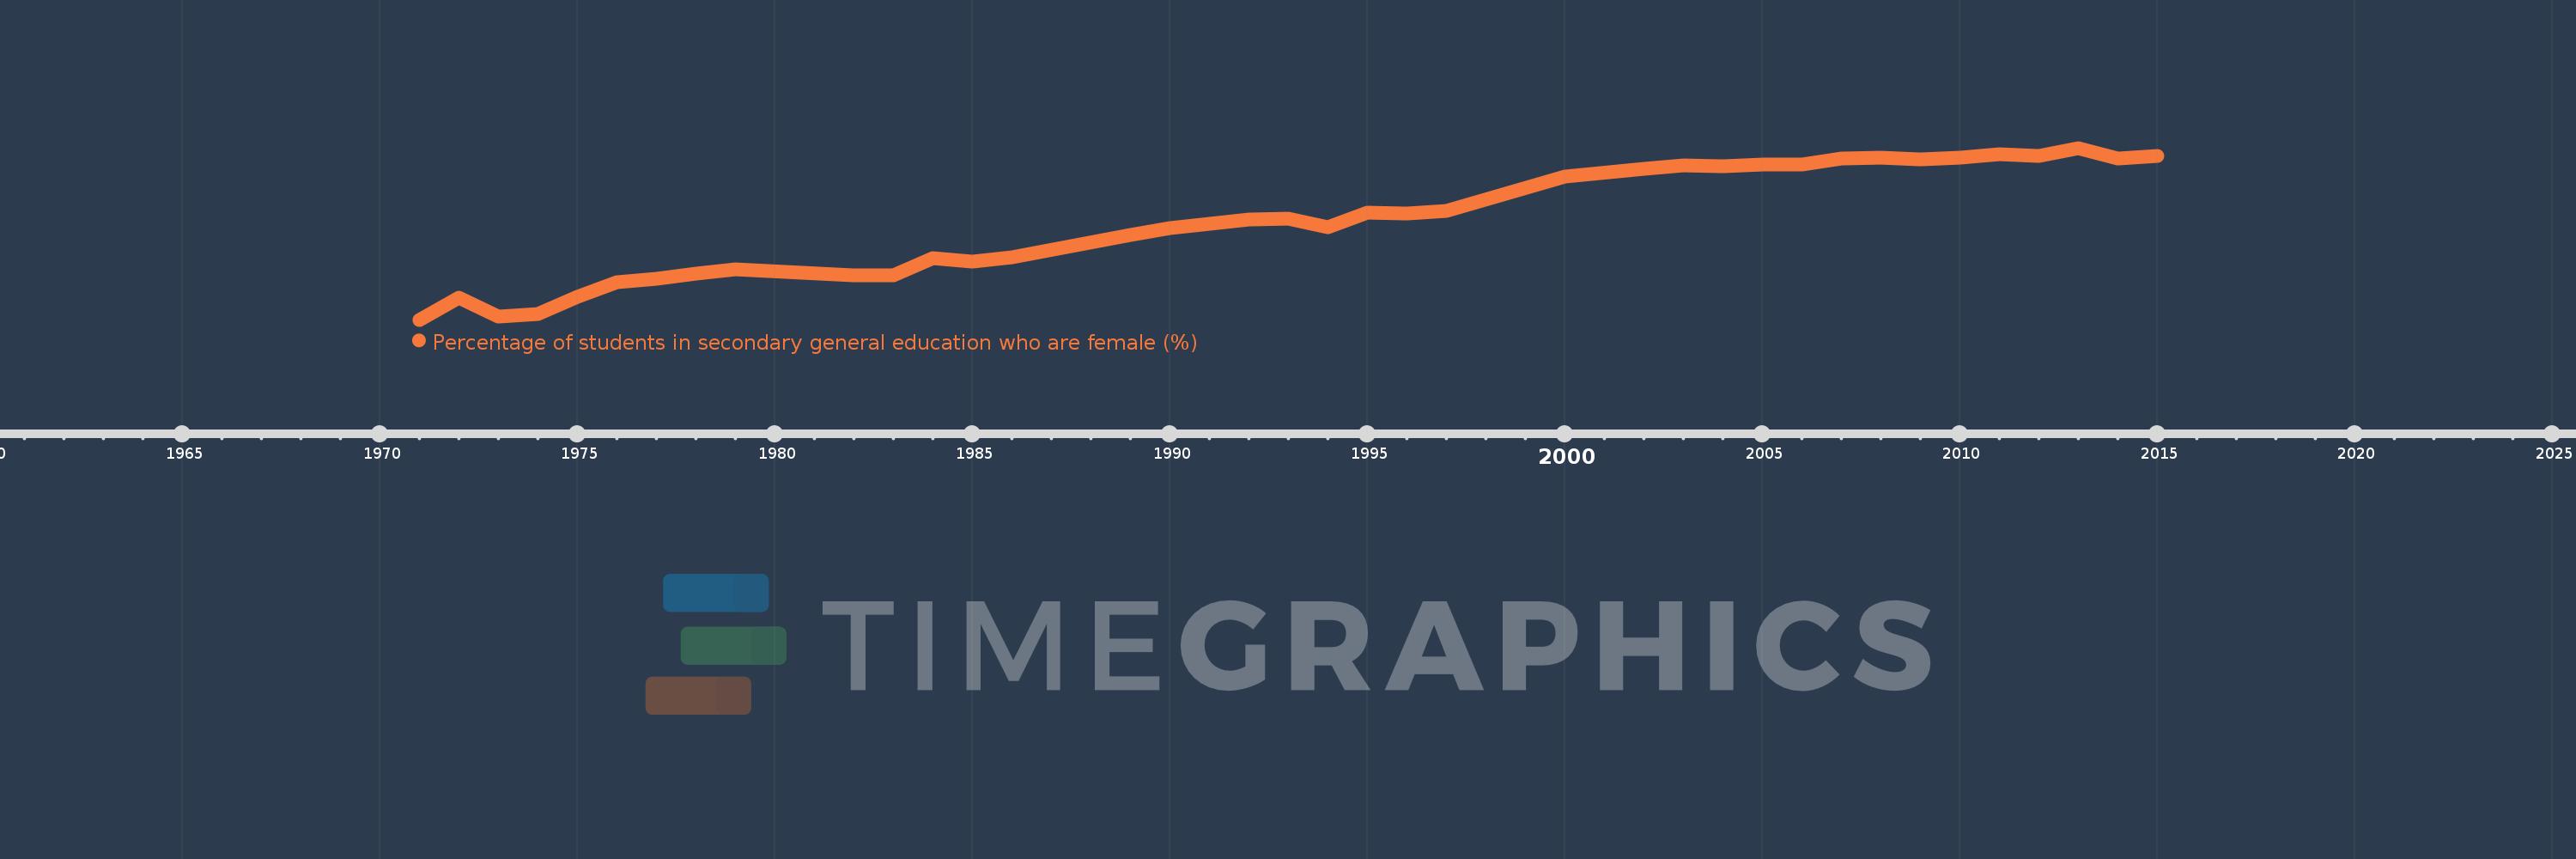
Percentage of students in secondary general education who are female (%)
2015,2014,2013,2012,2011,2010,2009,2008,2007,2006,2005,2004,2003,2002,2000,1997,1996,1995,1994,1993,1992,1991,1990,1989,1986,1985,1984,1983,1982,1979,1978,1977,1976,1975,1974,1973,1972,1971
This statistics in other country:
AfghanistanAlbaniaAlgeriaAndorraAngolaAntigua and BarbudaArab WorldArgentinaArmeniaArubaAustraliaAustriaAzerbaijanBahamas, TheBahrainBangladeshBarbadosBelarusBelgiumBelizeBeninBermudaBhutanBoliviaBosnia and HerzegovinaBotswanaBrazilBritish Virgin IslandsBrunei DarussalamBulgariaBurkina FasoBurundiCabo VerdeCambodiaCameroonCanadaCaribbean small statesCayman IslandsCentral African RepublicCentral Europe and the BalticsChadChileChinaColombiaComorosCongo, Dem. Rep.Congo, Rep.Costa RicaCote d'IvoireCroatiaCubaCuracaoCyprusCzech RepublicDenmarkDjiboutiDominicaDominican RepublicEarly-demographic dividendEast Asia & PacificEast Asia & Pacific (excluding high income)East Asia & Pacific (IDA & IBRD countries)EcuadorEgypt, Arab Rep.El SalvadorEquatorial GuineaEritreaEstoniaEthiopiaEuro areaEurope & Central AsiaEurope & Central Asia (excluding high income)Europe & Central Asia (IDA & IBRD countries)European UnionFijiFinlandFragile and conflict affected situationsFranceGabonGambia, TheGeorgiaGermanyGhanaGibraltarGreeceGrenadaGuatemalaGuineaGuinea-BissauGuyanaHaitiHeavily indebted poor countries (HIPC)High incomeHondurasHong Kong SAR, ChinaHungaryIBRD onlyIcelandIDA & IBRD totalIDA blendIDA onlyIDA totalIndiaIndonesiaIran, Islamic Rep.IraqIrelandIsraelItalyJamaicaJapanJordanKazakhstanKenyaKiribatiKorea, Dem. People’s Rep.Korea, Rep.KuwaitKyrgyz RepublicLao PDRLate-demographic dividendLatin America & Caribbean Latin America & Caribbean (excluding high income)Latin America & the Caribbean (IDA & IBRD countries)LatviaLeast developed countries: UN classificationLebanonLesothoLiberiaLibyaLiechtensteinLithuaniaLow & middle incomeLow incomeLower middle incomeLuxembourgMacao SAR, ChinaMacedonia, FYRMadagascarMalawiMalaysiaMaldivesMaliMaltaMarshall IslandsMauritaniaMauritiusMexicoMicronesia, Fed. Sts.Middle East & North AfricaMiddle East & North Africa (excluding high income)Middle East & North Africa (IDA & IBRD countries)Middle incomeMoldovaMonacoMongoliaMontenegroMoroccoMozambiqueMyanmarNamibiaNauruNepalNetherlandsNew ZealandNicaraguaNigerNigeriaNorth AmericaNorwayOECD membersOmanOther small statesPacific island small statesPakistanPalauPanamaPapua New GuineaParaguayPeruPhilippinesPolandPortugalPost-demographic dividendPre-demographic dividendPuerto RicoQatarRomaniaRussian FederationRwandaSamoaSan MarinoSao Tome and PrincipeSaudi ArabiaSenegalSerbiaSeychellesSierra LeoneSingaporeSint Maarten (Dutch part)Slovak RepublicSloveniaSmall statesSolomon IslandsSomaliaSouth AfricaSouth AsiaSouth Asia (IDA & IBRD)South SudanSpainSri LankaSt. Kitts and NevisSt. LuciaSt. Vincent and the GrenadinesSub-Saharan Africa Sub-Saharan Africa (excluding high income)Sub-Saharan Africa (IDA & IBRD countries)SudanSurinameSwazilandSwedenSwitzerlandSyrian Arab RepublicTajikistanTanzaniaThailandTimor-LesteTogoTongaTrinidad and TobagoTunisiaTurkeyTurkmenistanTurks and Caicos IslandsTuvaluUgandaUkraineUnited Arab EmiratesUnited KingdomUnited StatesUpper middle incomeUruguayUzbekistanVanuatuVenezuela, RBVietnamWest Bank and GazaWorldYemen, Rep.ZambiaZimbabwe Timeline:
This timeline shows a graph from 1971 to 2015 of Indonesia. No data until 1970. Number of actual observations by date: 38.
Source name:
World Development Indicators
Source organization:
UNESCO Institute for Statistics
Categories, topics:
Education, Gender
Last updated:
apr 23, 2017
Indicators value changes by year
Maximum:
51.332
jan 1, 2013
At the date of observation
Value
Absolute change
Change from previous value
jan 1, 1971
37.1
+37.1
0.0%
jan 1, 1972
38.905
+1.805
4.87%
jan 1, 1973
37.368
-1.537
-3.95%
jan 1, 1974
37.602
+0.234
0.63%
jan 1, 1975
39.0
+1.398
3.72%
jan 1, 1976
40.179
+1.179
3.02%
jan 1, 1977
40.497
+0.318
0.79%
jan 1, 1978
40.937
+0.44
1.09%
jan 1, 1979
41.287
+0.35
0.85%
jan 1, 1982
40.779
-0.508
-1.23%
jan 1, 1983
40.805
+0.026
0.06%
jan 1, 1984
42.223
+1.418
3.48%
jan 1, 1985
41.949
-0.274
-0.65%
jan 1, 1986
42.238
+0.289
0.69%
jan 1, 1989
44.135
+1.897
4.49%
jan 1, 1990
44.7
+0.566
1.28%
jan 1, 1991
45.05
+0.35
0.78%
jan 1, 1992
45.387
+0.337
0.75%
jan 1, 1993
45.449
+0.063
0.14%
jan 1, 1994
44.761
-0.689
-1.52%
jan 1, 1995
45.943
+1.182
2.64%
jan 1, 1996
45.909
-0.034
-0.07%
jan 1, 1997
46.096
+0.187
0.41%
jan 1, 2000
48.978
+2.881
6.25%
jan 1, 2002
49.616
+0.638
1.3%
jan 1, 2003
49.91
+0.294
0.59%
jan 1, 2004
49.849
-0.06
-0.12%
jan 1, 2005
49.966
+0.116
0.23%
jan 1, 2006
49.987
+0.021
0.04%
jan 1, 2007
50.47
+0.483
0.97%
jan 1, 2008
50.514
+0.043
0.09%
jan 1, 2009
50.368
-0.145
-0.29%
jan 1, 2010
50.502
+0.134
0.27%
jan 1, 2011
50.801
+0.299
0.59%
jan 1, 2012
50.704
-0.098
-0.19%
jan 1, 2013
51.332
+0.628
1.24%
jan 1, 2014
50.48
-0.852
-1.66%
jan 1, 2015
50.696
+0.216
0.43%
Ranking of countries by current statistics by years


Comments: