29
/
en
AIzaSyAYiBZKx7MnpbEhh9jyipgxe19OcubqV5w
April 1, 2024
106409
China
CHN
true
2
1
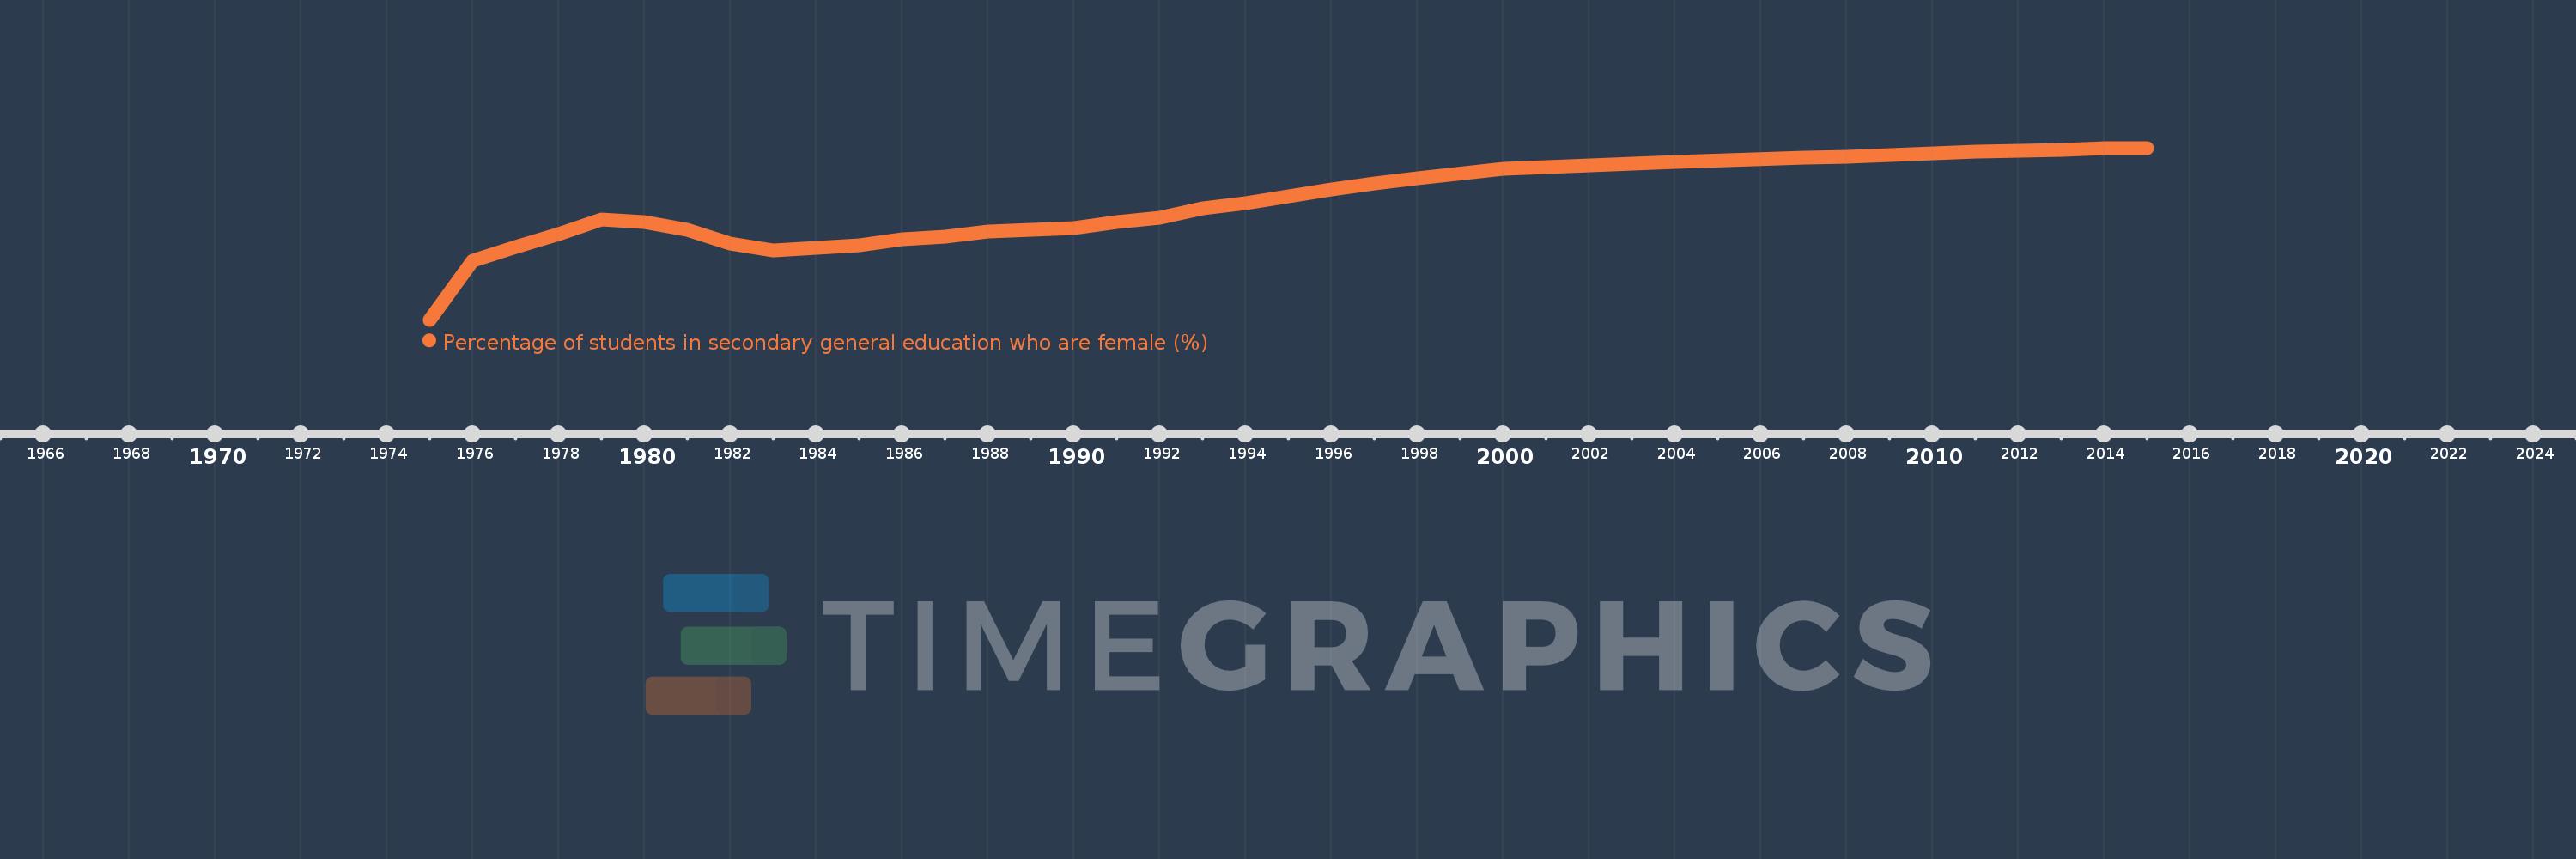
Percentage of students in secondary general education who are female (%)
2015,2014,2013,2012,2011,2010,2009,2008,2007,2004,2000,1998,1997,1996,1995,1994,1993,1992,1991,1990,1989,1988,1987,1986,1985,1984,1983,1982,1981,1980,1979,1978,1977,1976,1975
This statistics in other country:
AfghanistanAlbaniaAlgeriaAndorraAngolaAntigua and BarbudaArab WorldArgentinaArmeniaArubaAustraliaAustriaAzerbaijanBahamas, TheBahrainBangladeshBarbadosBelarusBelgiumBelizeBeninBermudaBhutanBoliviaBosnia and HerzegovinaBotswanaBrazilBritish Virgin IslandsBrunei DarussalamBulgariaBurkina FasoBurundiCabo VerdeCambodiaCameroonCanadaCaribbean small statesCayman IslandsCentral African RepublicCentral Europe and the BalticsChadChileChinaColombiaComorosCongo, Dem. Rep.Congo, Rep.Costa RicaCote d'IvoireCroatiaCubaCuracaoCyprusCzech RepublicDenmarkDjiboutiDominicaDominican RepublicEarly-demographic dividendEast Asia & PacificEast Asia & Pacific (excluding high income)East Asia & Pacific (IDA & IBRD countries)EcuadorEgypt, Arab Rep.El SalvadorEquatorial GuineaEritreaEstoniaEthiopiaEuro areaEurope & Central AsiaEurope & Central Asia (excluding high income)Europe & Central Asia (IDA & IBRD countries)European UnionFijiFinlandFragile and conflict affected situationsFranceGabonGambia, TheGeorgiaGermanyGhanaGibraltarGreeceGrenadaGuatemalaGuineaGuinea-BissauGuyanaHaitiHeavily indebted poor countries (HIPC)High incomeHondurasHong Kong SAR, ChinaHungaryIBRD onlyIcelandIDA & IBRD totalIDA blendIDA onlyIDA totalIndiaIndonesiaIran, Islamic Rep.IraqIrelandIsraelItalyJamaicaJapanJordanKazakhstanKenyaKiribatiKorea, Dem. People’s Rep.Korea, Rep.KuwaitKyrgyz RepublicLao PDRLate-demographic dividendLatin America & Caribbean Latin America & Caribbean (excluding high income)Latin America & the Caribbean (IDA & IBRD countries)LatviaLeast developed countries: UN classificationLebanonLesothoLiberiaLibyaLiechtensteinLithuaniaLow & middle incomeLow incomeLower middle incomeLuxembourgMacao SAR, ChinaMacedonia, FYRMadagascarMalawiMalaysiaMaldivesMaliMaltaMarshall IslandsMauritaniaMauritiusMexicoMicronesia, Fed. Sts.Middle East & North AfricaMiddle East & North Africa (excluding high income)Middle East & North Africa (IDA & IBRD countries)Middle incomeMoldovaMonacoMongoliaMontenegroMoroccoMozambiqueMyanmarNamibiaNauruNepalNetherlandsNew ZealandNicaraguaNigerNigeriaNorth AmericaNorwayOECD membersOmanOther small statesPacific island small statesPakistanPalauPanamaPapua New GuineaParaguayPeruPhilippinesPolandPortugalPost-demographic dividendPre-demographic dividendPuerto RicoQatarRomaniaRussian FederationRwandaSamoaSan MarinoSao Tome and PrincipeSaudi ArabiaSenegalSerbiaSeychellesSierra LeoneSingaporeSint Maarten (Dutch part)Slovak RepublicSloveniaSmall statesSolomon IslandsSomaliaSouth AfricaSouth AsiaSouth Asia (IDA & IBRD)South SudanSpainSri LankaSt. Kitts and NevisSt. LuciaSt. Vincent and the GrenadinesSub-Saharan Africa Sub-Saharan Africa (excluding high income)Sub-Saharan Africa (IDA & IBRD countries)SudanSurinameSwazilandSwedenSwitzerlandSyrian Arab RepublicTajikistanTanzaniaThailandTimor-LesteTogoTongaTrinidad and TobagoTunisiaTurkeyTurkmenistanTurks and Caicos IslandsTuvaluUgandaUkraineUnited Arab EmiratesUnited KingdomUnited StatesUpper middle incomeUruguayUzbekistanVanuatuVenezuela, RBVietnamWest Bank and GazaWorldYemen, Rep.ZambiaZimbabwe Timeline:
This timeline shows a graph from 1975 to 2015 of China. No data until 1974. Number of actual observations by date: 35.
Source name:
World Development Indicators
Source organization:
UNESCO Institute for Statistics
Categories, topics:
Education, Gender
Last updated:
apr 23, 2017
Indicators value changes by year
Minimum:
32.988
jan 1, 1975
Maximum:
47.901
jan 1, 2015
At the date of observation
Value
Absolute change
Change from previous value
jan 1, 1975
32.988
+32.988
0.0%
jan 1, 1976
38.137
+5.149
15.61%
jan 1, 1977
39.267
+1.13
2.96%
jan 1, 1978
40.385
+1.118
2.85%
jan 1, 1979
41.673
+1.288
3.19%
jan 1, 1980
41.469
-0.204
-0.49%
jan 1, 1981
40.822
-0.647
-1.56%
jan 1, 1982
39.58
-1.242
-3.04%
jan 1, 1983
39.003
-0.576
-1.46%
jan 1, 1984
39.249
+0.246
0.63%
jan 1, 1985
39.455
+0.206
0.52%
jan 1, 1986
40.005
+0.55
1.39%
jan 1, 1987
40.228
+0.224
0.56%
jan 1, 1988
40.652
+0.424
1.05%
jan 1, 1989
40.796
+0.144
0.35%
jan 1, 1990
40.978
+0.182
0.45%
jan 1, 1991
41.442
+0.464
1.13%
jan 1, 1992
41.869
+0.427
1.03%
jan 1, 1993
42.653
+0.783
1.87%
jan 1, 1994
43.106
+0.453
1.06%
jan 1, 1995
43.715
+0.608
1.41%
jan 1, 1996
44.302
+0.588
1.34%
jan 1, 1997
44.824
+0.522
1.18%
jan 1, 1998
45.293
+0.468
1.05%
jan 1, 2000
46.1
+0.807
1.78%
jan 1, 2004
46.677
+0.577
1.25%
jan 1, 2007
47.063
+0.387
0.83%
jan 1, 2008
47.132
+0.068
0.15%
jan 1, 2009
47.294
+0.162
0.34%
jan 1, 2010
47.465
+0.171
0.36%
jan 1, 2011
47.576
+0.111
0.23%
jan 1, 2012
47.638
+0.062
0.13%
jan 1, 2013
47.71
+0.072
0.15%
jan 1, 2014
47.858
+0.149
0.31%
jan 1, 2015
47.901
+0.043
0.09%
Ranking of countries by current statistics by years


Comments: