29
/
en
AIzaSyAYiBZKx7MnpbEhh9jyipgxe19OcubqV5w
April 1, 2024
275121
United Arab Emirates
ARE
true
2
1
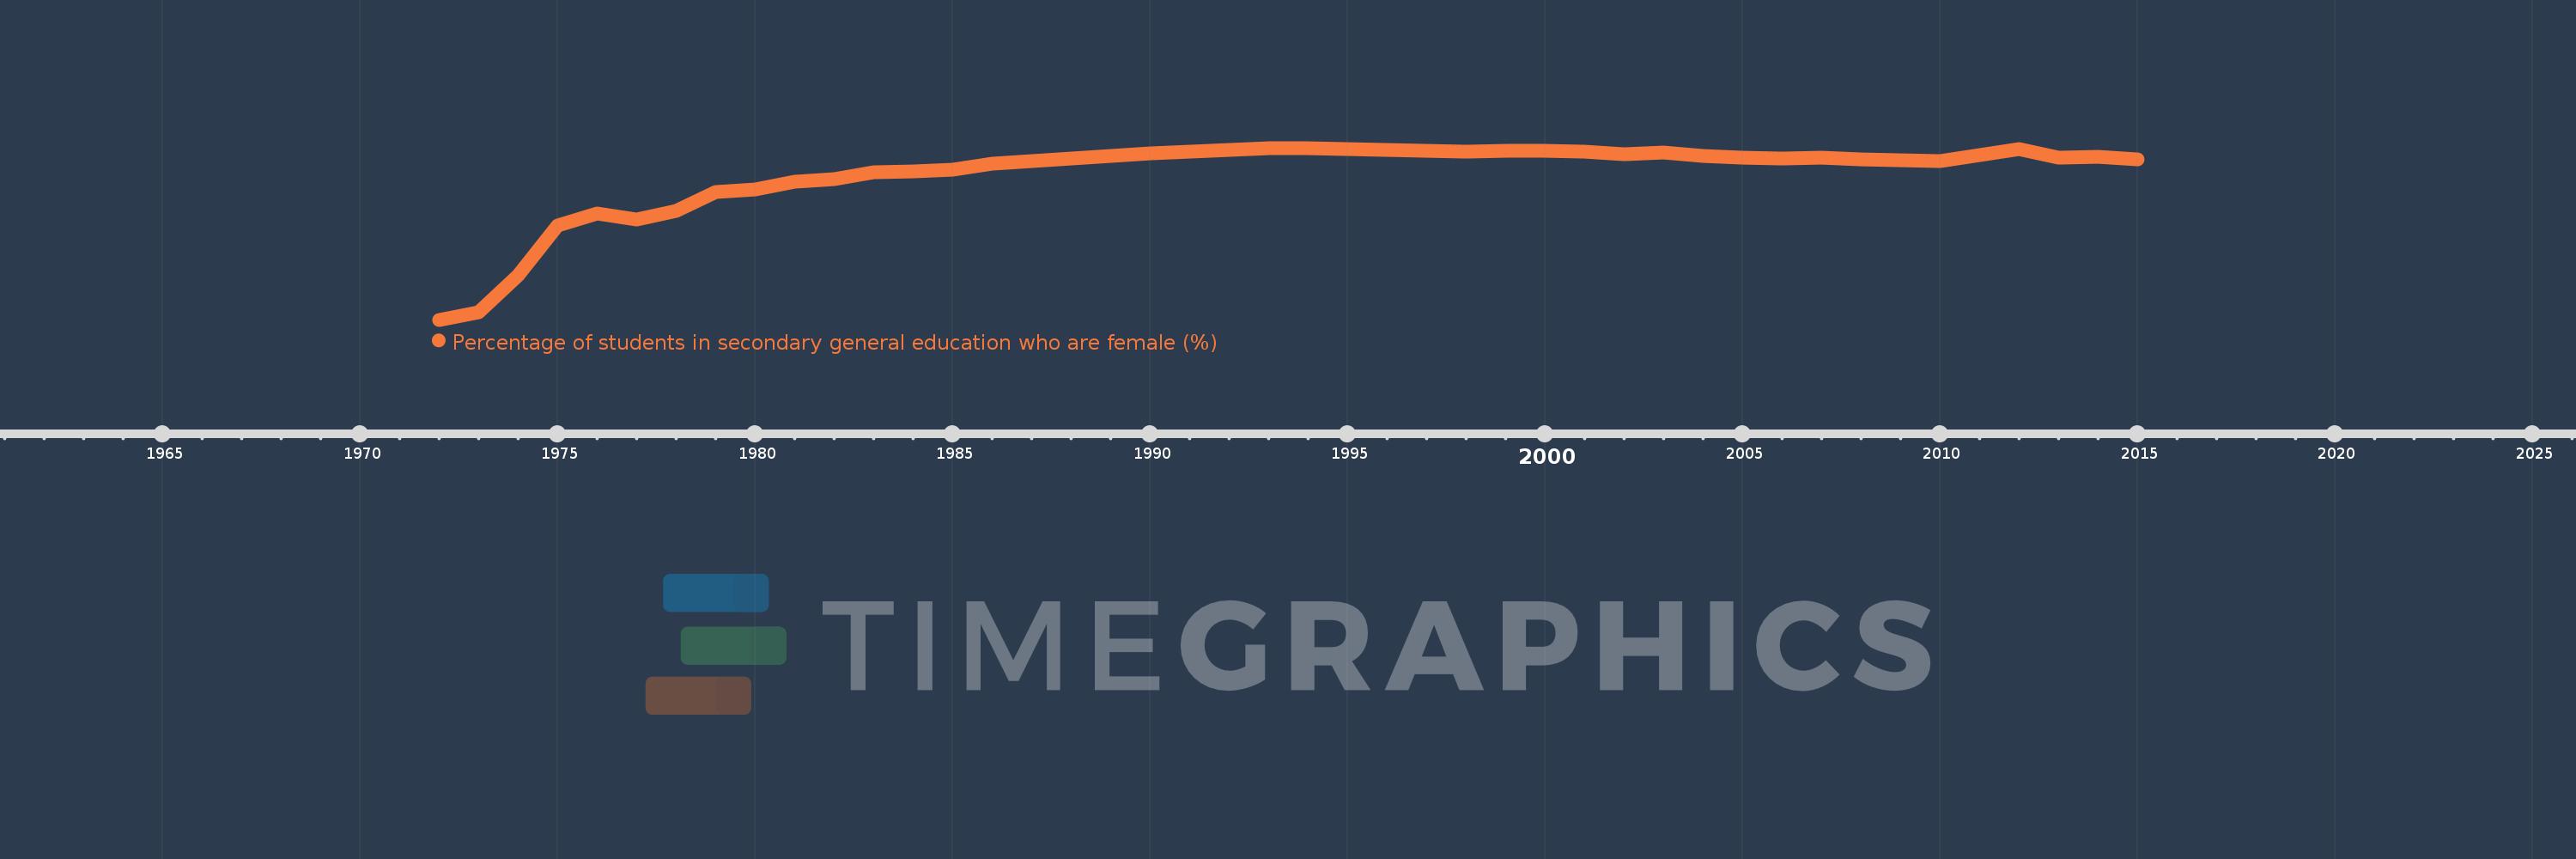
Percentage of students in secondary general education who are female (%)
2015,2014,2013,2012,2011,2010,2008,2007,2006,2005,2004,2003,2002,2001,2000,1999,1998,1996,1995,1994,1993,1992,1991,1990,1989,1988,1987,1986,1985,1984,1983,1982,1981,1980,1979,1978,1977,1976,1975,1974,1973,1972
This statistics in other country:
AfghanistanAlbaniaAlgeriaAndorraAngolaAntigua and BarbudaArab WorldArgentinaArmeniaArubaAustraliaAustriaAzerbaijanBahamas, TheBahrainBangladeshBarbadosBelarusBelgiumBelizeBeninBermudaBhutanBoliviaBosnia and HerzegovinaBotswanaBrazilBritish Virgin IslandsBrunei DarussalamBulgariaBurkina FasoBurundiCabo VerdeCambodiaCameroonCanadaCaribbean small statesCayman IslandsCentral African RepublicCentral Europe and the BalticsChadChileChinaColombiaComorosCongo, Dem. Rep.Congo, Rep.Costa RicaCote d'IvoireCroatiaCubaCuracaoCyprusCzech RepublicDenmarkDjiboutiDominicaDominican RepublicEarly-demographic dividendEast Asia & PacificEast Asia & Pacific (excluding high income)East Asia & Pacific (IDA & IBRD countries)EcuadorEgypt, Arab Rep.El SalvadorEquatorial GuineaEritreaEstoniaEthiopiaEuro areaEurope & Central AsiaEurope & Central Asia (excluding high income)Europe & Central Asia (IDA & IBRD countries)European UnionFijiFinlandFragile and conflict affected situationsFranceGabonGambia, TheGeorgiaGermanyGhanaGibraltarGreeceGrenadaGuatemalaGuineaGuinea-BissauGuyanaHaitiHeavily indebted poor countries (HIPC)High incomeHondurasHong Kong SAR, ChinaHungaryIBRD onlyIcelandIDA & IBRD totalIDA blendIDA onlyIDA totalIndiaIndonesiaIran, Islamic Rep.IraqIrelandIsraelItalyJamaicaJapanJordanKazakhstanKenyaKiribatiKorea, Dem. People’s Rep.Korea, Rep.KuwaitKyrgyz RepublicLao PDRLate-demographic dividendLatin America & Caribbean Latin America & Caribbean (excluding high income)Latin America & the Caribbean (IDA & IBRD countries)LatviaLeast developed countries: UN classificationLebanonLesothoLiberiaLibyaLiechtensteinLithuaniaLow & middle incomeLow incomeLower middle incomeLuxembourgMacao SAR, ChinaMacedonia, FYRMadagascarMalawiMalaysiaMaldivesMaliMaltaMarshall IslandsMauritaniaMauritiusMexicoMicronesia, Fed. Sts.Middle East & North AfricaMiddle East & North Africa (excluding high income)Middle East & North Africa (IDA & IBRD countries)Middle incomeMoldovaMonacoMongoliaMontenegroMoroccoMozambiqueMyanmarNamibiaNauruNepalNetherlandsNew ZealandNicaraguaNigerNigeriaNorth AmericaNorwayOECD membersOmanOther small statesPacific island small statesPakistanPalauPanamaPapua New GuineaParaguayPeruPhilippinesPolandPortugalPost-demographic dividendPre-demographic dividendPuerto RicoQatarRomaniaRussian FederationRwandaSamoaSan MarinoSao Tome and PrincipeSaudi ArabiaSenegalSerbiaSeychellesSierra LeoneSingaporeSint Maarten (Dutch part)Slovak RepublicSloveniaSmall statesSolomon IslandsSomaliaSouth AfricaSouth AsiaSouth Asia (IDA & IBRD)South SudanSpainSri LankaSt. Kitts and NevisSt. LuciaSt. Vincent and the GrenadinesSub-Saharan Africa Sub-Saharan Africa (excluding high income)Sub-Saharan Africa (IDA & IBRD countries)SudanSurinameSwazilandSwedenSwitzerlandSyrian Arab RepublicTajikistanTanzaniaThailandTimor-LesteTogoTongaTrinidad and TobagoTunisiaTurkeyTurkmenistanTurks and Caicos IslandsTuvaluUgandaUkraineUnited Arab EmiratesUnited KingdomUnited StatesUpper middle incomeUruguayUzbekistanVanuatuVenezuela, RBVietnamWest Bank and GazaWorldYemen, Rep.ZambiaZimbabwe Timeline:
This timeline shows a graph from 1972 to 2015 of United Arab Emirates. No data until 1971. Number of actual observations by date: 42.
Source name:
World Development Indicators
Source organization:
UNESCO Institute for Statistics
Categories, topics:
Education, Gender
Last updated:
apr 23, 2017
Indicators value changes by year
Minimum:
18.613
jan 1, 1972
Maximum:
51.115
jan 1, 1994
At the date of observation
Value
Absolute change
Change from previous value
jan 1, 1972
18.613
+18.613
0.0%
jan 1, 1973
20.042
+1.43
7.68%
jan 1, 1974
26.988
+6.946
34.66%
jan 1, 1975
36.406
+9.418
34.9%
jan 1, 1976
38.657
+2.251
6.18%
jan 1, 1977
37.611
-1.046
-2.71%
jan 1, 1978
39.267
+1.656
4.4%
jan 1, 1979
42.789
+3.522
8.97%
jan 1, 1980
43.25
+0.461
1.08%
jan 1, 1981
44.772
+1.522
3.52%
jan 1, 1982
45.244
+0.473
1.06%
jan 1, 1983
46.486
+1.241
2.74%
jan 1, 1984
46.703
+0.217
0.47%
jan 1, 1985
47.066
+0.363
0.78%
jan 1, 1986
48.117
+1.051
2.23%
jan 1, 1987
48.603
+0.486
1.01%
jan 1, 1988
49.173
+0.57
1.17%
jan 1, 1989
49.652
+0.48
0.98%
jan 1, 1990
50.151
+0.498
1.0%
jan 1, 1991
50.484
+0.333
0.66%
jan 1, 1992
50.732
+0.249
0.49%
jan 1, 1993
51.02
+0.288
0.57%
jan 1, 1994
51.115
+0.095
0.19%
jan 1, 1995
50.974
-0.141
-0.28%
jan 1, 1996
50.673
-0.301
-0.59%
jan 1, 1998
50.434
-0.239
-0.47%
jan 1, 1999
50.653
+0.219
0.43%
jan 1, 2000
50.559
-0.094
-0.19%
jan 1, 2001
50.411
-0.148
-0.29%
jan 1, 2002
49.966
-0.445
-0.88%
jan 1, 2003
50.23
+0.264
0.53%
jan 1, 2004
49.682
-0.548
-1.09%
jan 1, 2005
49.347
-0.335
-0.67%
jan 1, 2006
49.142
-0.205
-0.42%
jan 1, 2007
49.202
+0.061
0.12%
jan 1, 2008
48.99
-0.212
-0.43%
jan 1, 2010
48.689
-0.301
-0.61%
jan 1, 2011
49.755
+1.065
2.19%
jan 1, 2012
50.893
+1.138
2.29%
jan 1, 2013
49.349
-1.544
-3.03%
jan 1, 2014
49.412
+0.063
0.13%
jan 1, 2015
48.89
-0.521
-1.06%
Ranking of countries by current statistics by years


Comments: