29
/
en
AIzaSyAYiBZKx7MnpbEhh9jyipgxe19OcubqV5w
April 1, 2024
161844
Italy
ITA
true
2
1
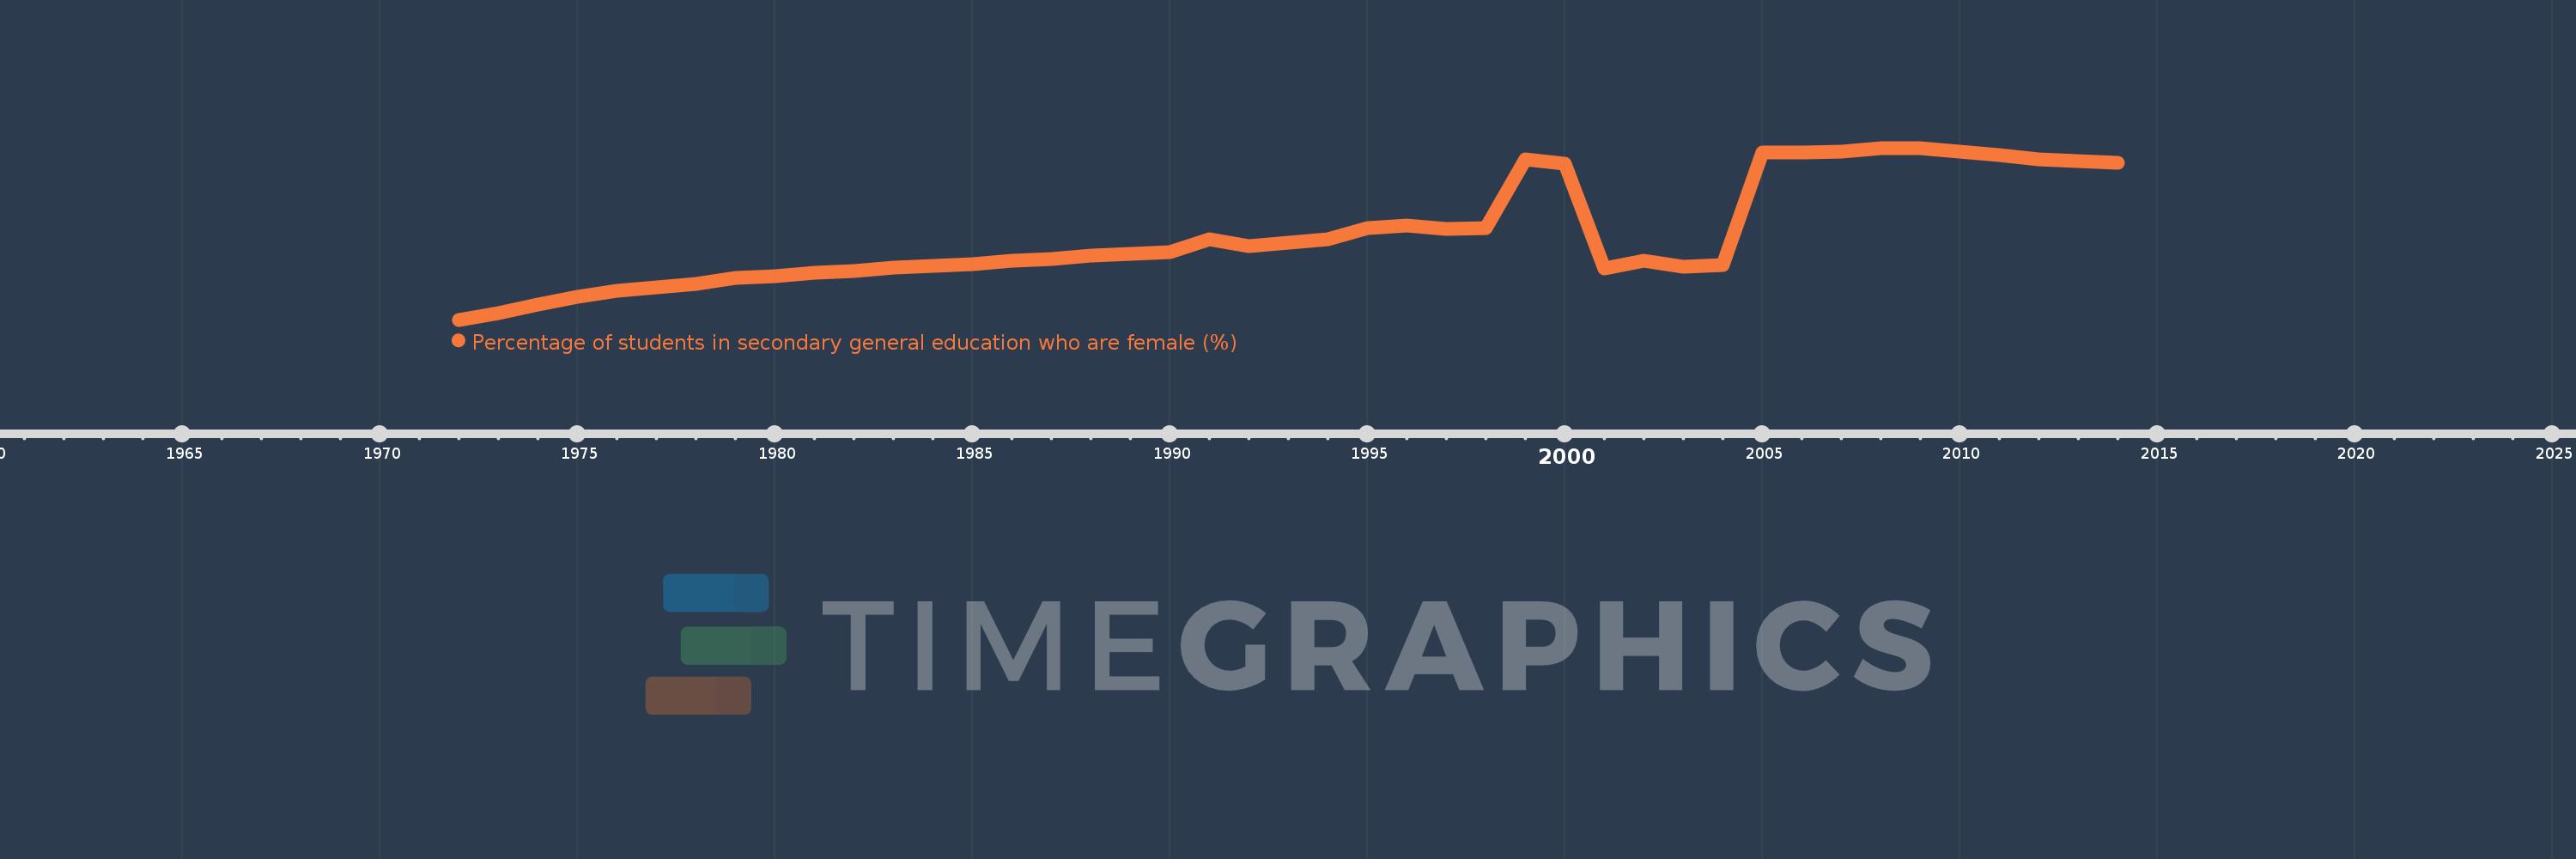
Percentage of students in secondary general education who are female (%)
2014,2013,2012,2011,2010,2009,2008,2007,2006,2005,2004,2003,2002,2001,2000,1999,1998,1997,1996,1995,1994,1993,1992,1991,1990,1989,1988,1987,1986,1985,1984,1983,1982,1981,1980,1979,1978,1977,1976,1975,1974,1973,1972
This statistics in other country:
AfghanistanAlbaniaAlgeriaAndorraAngolaAntigua and BarbudaArab WorldArgentinaArmeniaArubaAustraliaAustriaAzerbaijanBahamas, TheBahrainBangladeshBarbadosBelarusBelgiumBelizeBeninBermudaBhutanBoliviaBosnia and HerzegovinaBotswanaBrazilBritish Virgin IslandsBrunei DarussalamBulgariaBurkina FasoBurundiCabo VerdeCambodiaCameroonCanadaCaribbean small statesCayman IslandsCentral African RepublicCentral Europe and the BalticsChadChileChinaColombiaComorosCongo, Dem. Rep.Congo, Rep.Costa RicaCote d'IvoireCroatiaCubaCuracaoCyprusCzech RepublicDenmarkDjiboutiDominicaDominican RepublicEarly-demographic dividendEast Asia & PacificEast Asia & Pacific (excluding high income)East Asia & Pacific (IDA & IBRD countries)EcuadorEgypt, Arab Rep.El SalvadorEquatorial GuineaEritreaEstoniaEthiopiaEuro areaEurope & Central AsiaEurope & Central Asia (excluding high income)Europe & Central Asia (IDA & IBRD countries)European UnionFijiFinlandFragile and conflict affected situationsFranceGabonGambia, TheGeorgiaGermanyGhanaGibraltarGreeceGrenadaGuatemalaGuineaGuinea-BissauGuyanaHaitiHeavily indebted poor countries (HIPC)High incomeHondurasHong Kong SAR, ChinaHungaryIBRD onlyIcelandIDA & IBRD totalIDA blendIDA onlyIDA totalIndiaIndonesiaIran, Islamic Rep.IraqIrelandIsraelItalyJamaicaJapanJordanKazakhstanKenyaKiribatiKorea, Dem. People’s Rep.Korea, Rep.KuwaitKyrgyz RepublicLao PDRLate-demographic dividendLatin America & Caribbean Latin America & Caribbean (excluding high income)Latin America & the Caribbean (IDA & IBRD countries)LatviaLeast developed countries: UN classificationLebanonLesothoLiberiaLibyaLiechtensteinLithuaniaLow & middle incomeLow incomeLower middle incomeLuxembourgMacao SAR, ChinaMacedonia, FYRMadagascarMalawiMalaysiaMaldivesMaliMaltaMarshall IslandsMauritaniaMauritiusMexicoMicronesia, Fed. Sts.Middle East & North AfricaMiddle East & North Africa (excluding high income)Middle East & North Africa (IDA & IBRD countries)Middle incomeMoldovaMonacoMongoliaMontenegroMoroccoMozambiqueMyanmarNamibiaNauruNepalNetherlandsNew ZealandNicaraguaNigerNigeriaNorth AmericaNorwayOECD membersOmanOther small statesPacific island small statesPakistanPalauPanamaPapua New GuineaParaguayPeruPhilippinesPolandPortugalPost-demographic dividendPre-demographic dividendPuerto RicoQatarRomaniaRussian FederationRwandaSamoaSan MarinoSao Tome and PrincipeSaudi ArabiaSenegalSerbiaSeychellesSierra LeoneSingaporeSint Maarten (Dutch part)Slovak RepublicSloveniaSmall statesSolomon IslandsSomaliaSouth AfricaSouth AsiaSouth Asia (IDA & IBRD)South SudanSpainSri LankaSt. Kitts and NevisSt. LuciaSt. Vincent and the GrenadinesSub-Saharan Africa Sub-Saharan Africa (excluding high income)Sub-Saharan Africa (IDA & IBRD countries)SudanSurinameSwazilandSwedenSwitzerlandSyrian Arab RepublicTajikistanTanzaniaThailandTimor-LesteTogoTongaTrinidad and TobagoTunisiaTurkeyTurkmenistanTurks and Caicos IslandsTuvaluUgandaUkraineUnited Arab EmiratesUnited KingdomUnited StatesUpper middle incomeUruguayUzbekistanVanuatuVenezuela, RBVietnamWest Bank and GazaWorldYemen, Rep.ZambiaZimbabwe Timeline:
This timeline shows a graph from 1972 to 2014 of Italy. No data until 1971. Number of actual observations by date: 43.
Source name:
World Development Indicators
Source organization:
UNESCO Institute for Statistics
Categories, topics:
Education, Gender
Last updated:
apr 23, 2017
Indicators value changes by year
Minimum:
46.101
jan 1, 1972
Maximum:
53.609
jan 1, 2009
At the date of observation
Value
Absolute change
Change from previous value
jan 1, 1972
46.101
+46.101
0.0%
jan 1, 1973
46.397
+0.297
0.64%
jan 1, 1974
46.768
+0.37
0.8%
jan 1, 1975
47.097
+0.33
0.7%
jan 1, 1976
47.376
+0.279
0.59%
jan 1, 1977
47.5
+0.124
0.26%
jan 1, 1978
47.67
+0.171
0.36%
jan 1, 1979
47.932
+0.262
0.55%
jan 1, 1980
48.005
+0.073
0.15%
jan 1, 1981
48.152
+0.148
0.31%
jan 1, 1982
48.228
+0.076
0.16%
jan 1, 1983
48.391
+0.163
0.34%
jan 1, 1984
48.439
+0.048
0.1%
jan 1, 1985
48.54
+0.101
0.21%
jan 1, 1986
48.675
+0.135
0.28%
jan 1, 1987
48.77
+0.095
0.2%
jan 1, 1988
48.892
+0.122
0.25%
jan 1, 1989
48.962
+0.07
0.14%
jan 1, 1990
49.041
+0.079
0.16%
jan 1, 1991
49.615
+0.574
1.17%
jan 1, 1992
49.32
-0.295
-0.6%
jan 1, 1993
49.48
+0.16
0.33%
jan 1, 1994
49.602
+0.122
0.25%
jan 1, 1995
50.093
+0.491
0.99%
jan 1, 1996
50.212
+0.119
0.24%
jan 1, 1997
50.071
-0.141
-0.28%
jan 1, 1998
50.12
+0.049
0.1%
jan 1, 1999
53.101
+2.981
5.95%
jan 1, 2000
52.908
-0.193
-0.36%
jan 1, 2001
48.328
-4.58
-8.66%
jan 1, 2002
48.665
+0.338
0.7%
jan 1, 2003
48.4
-0.266
-0.55%
jan 1, 2004
48.486
+0.087
0.18%
jan 1, 2005
53.42
+4.934
10.18%
jan 1, 2006
53.405
-0.015
-0.03%
jan 1, 2007
53.439
+0.034
0.06%
jan 1, 2008
53.6
+0.161
0.3%
jan 1, 2009
53.609
+0.01
0.02%
jan 1, 2010
53.446
-0.164
-0.31%
jan 1, 2011
53.299
-0.147
-0.27%
jan 1, 2012
53.11
-0.189
-0.35%
jan 1, 2013
53.019
-0.091
-0.17%
jan 1, 2014
52.945
-0.074
-0.14%
Ranking of countries by current statistics by years


Comments: