29
/
en
AIzaSyAYiBZKx7MnpbEhh9jyipgxe19OcubqV5w
April 1, 2024
168926
Kiribati
KIR
true
2
1
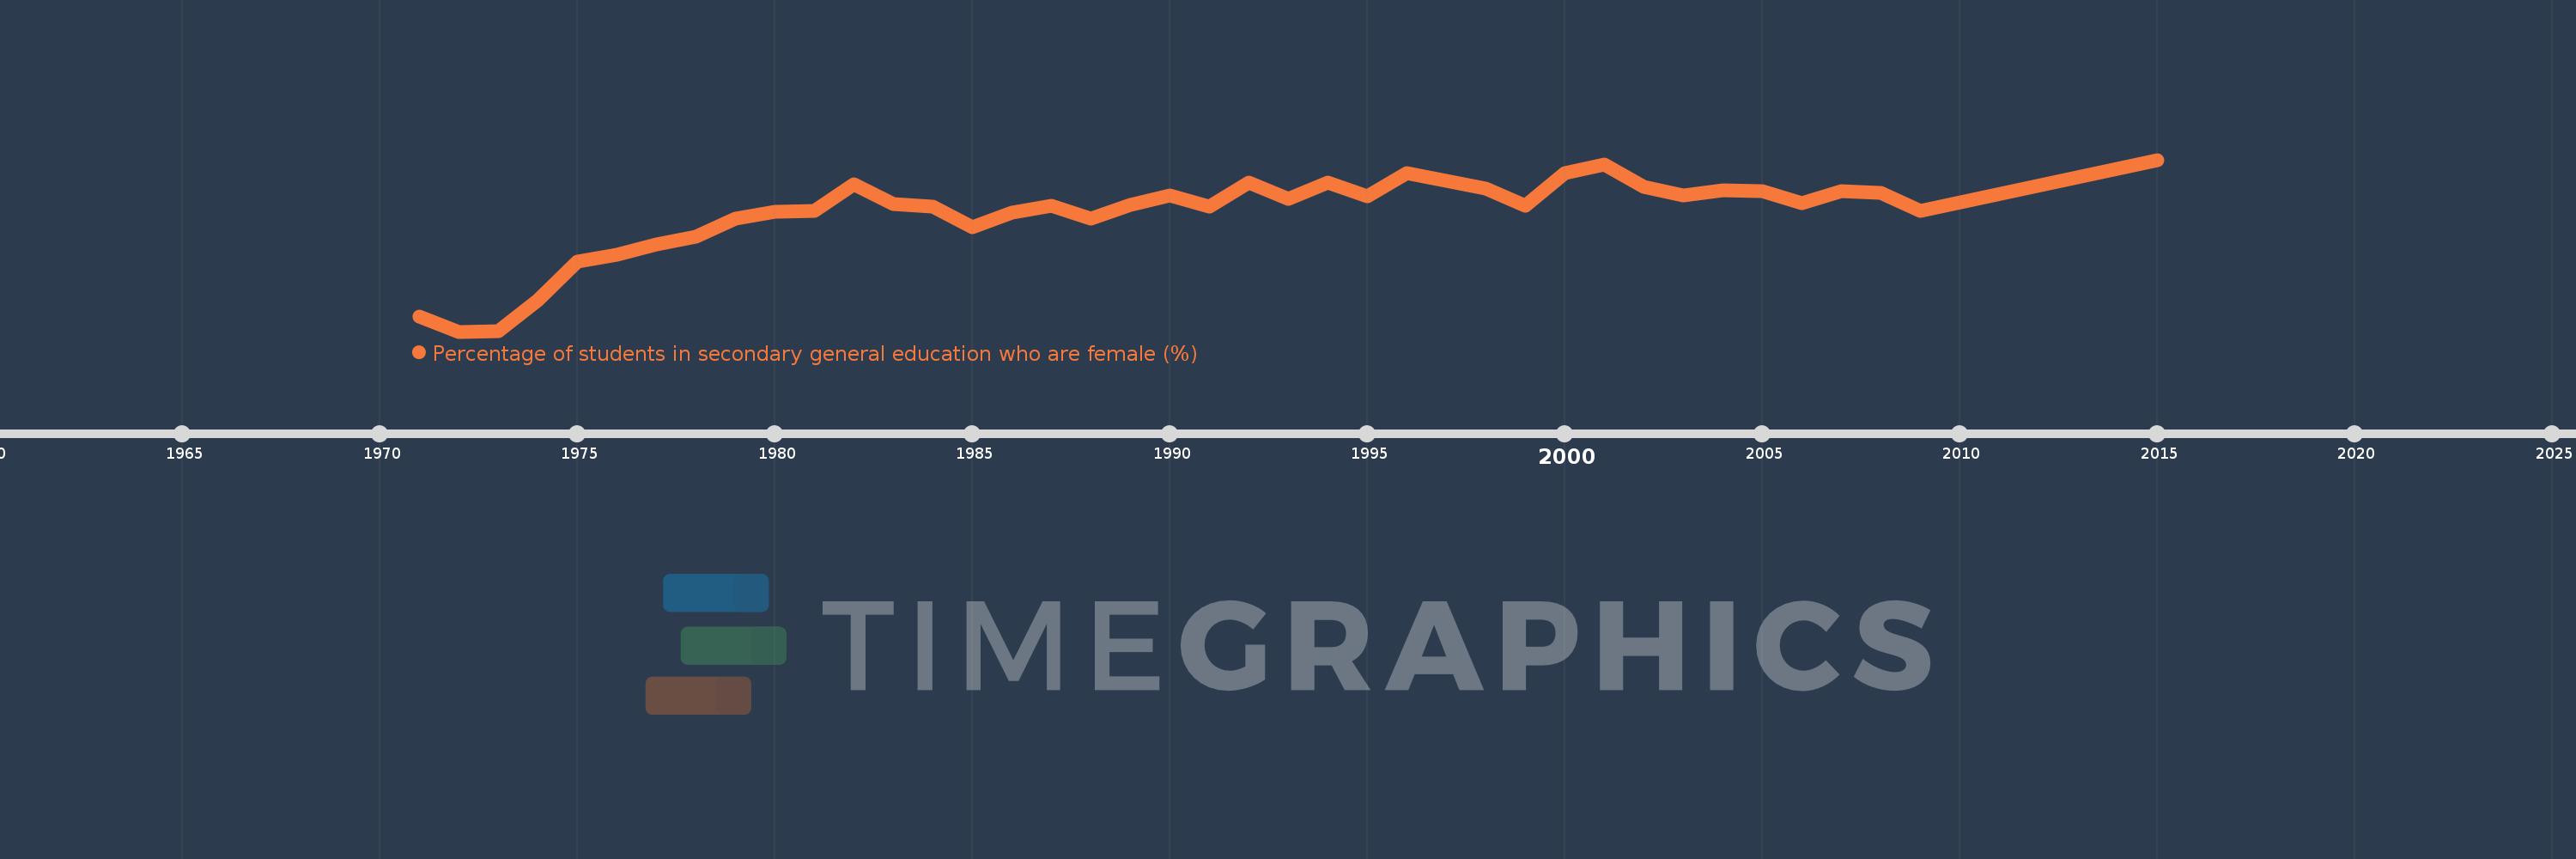
Percentage of students in secondary general education who are female (%)
2015,2009,2008,2007,2006,2005,2004,2003,2002,2001,2000,1999,1998,1997,1996,1995,1994,1993,1992,1991,1990,1989,1988,1987,1986,1985,1984,1983,1982,1981,1980,1979,1978,1977,1976,1975,1974,1973,1972,1971
This statistics in other country:
AfghanistanAlbaniaAlgeriaAndorraAngolaAntigua and BarbudaArab WorldArgentinaArmeniaArubaAustraliaAustriaAzerbaijanBahamas, TheBahrainBangladeshBarbadosBelarusBelgiumBelizeBeninBermudaBhutanBoliviaBosnia and HerzegovinaBotswanaBrazilBritish Virgin IslandsBrunei DarussalamBulgariaBurkina FasoBurundiCabo VerdeCambodiaCameroonCanadaCaribbean small statesCayman IslandsCentral African RepublicCentral Europe and the BalticsChadChileChinaColombiaComorosCongo, Dem. Rep.Congo, Rep.Costa RicaCote d'IvoireCroatiaCubaCuracaoCyprusCzech RepublicDenmarkDjiboutiDominicaDominican RepublicEarly-demographic dividendEast Asia & PacificEast Asia & Pacific (excluding high income)East Asia & Pacific (IDA & IBRD countries)EcuadorEgypt, Arab Rep.El SalvadorEquatorial GuineaEritreaEstoniaEthiopiaEuro areaEurope & Central AsiaEurope & Central Asia (excluding high income)Europe & Central Asia (IDA & IBRD countries)European UnionFijiFinlandFragile and conflict affected situationsFranceGabonGambia, TheGeorgiaGermanyGhanaGibraltarGreeceGrenadaGuatemalaGuineaGuinea-BissauGuyanaHaitiHeavily indebted poor countries (HIPC)High incomeHondurasHong Kong SAR, ChinaHungaryIBRD onlyIcelandIDA & IBRD totalIDA blendIDA onlyIDA totalIndiaIndonesiaIran, Islamic Rep.IraqIrelandIsraelItalyJamaicaJapanJordanKazakhstanKenyaKiribatiKorea, Dem. People’s Rep.Korea, Rep.KuwaitKyrgyz RepublicLao PDRLate-demographic dividendLatin America & Caribbean Latin America & Caribbean (excluding high income)Latin America & the Caribbean (IDA & IBRD countries)LatviaLeast developed countries: UN classificationLebanonLesothoLiberiaLibyaLiechtensteinLithuaniaLow & middle incomeLow incomeLower middle incomeLuxembourgMacao SAR, ChinaMacedonia, FYRMadagascarMalawiMalaysiaMaldivesMaliMaltaMarshall IslandsMauritaniaMauritiusMexicoMicronesia, Fed. Sts.Middle East & North AfricaMiddle East & North Africa (excluding high income)Middle East & North Africa (IDA & IBRD countries)Middle incomeMoldovaMonacoMongoliaMontenegroMoroccoMozambiqueMyanmarNamibiaNauruNepalNetherlandsNew ZealandNicaraguaNigerNigeriaNorth AmericaNorwayOECD membersOmanOther small statesPacific island small statesPakistanPalauPanamaPapua New GuineaParaguayPeruPhilippinesPolandPortugalPost-demographic dividendPre-demographic dividendPuerto RicoQatarRomaniaRussian FederationRwandaSamoaSan MarinoSao Tome and PrincipeSaudi ArabiaSenegalSerbiaSeychellesSierra LeoneSingaporeSint Maarten (Dutch part)Slovak RepublicSloveniaSmall statesSolomon IslandsSomaliaSouth AfricaSouth AsiaSouth Asia (IDA & IBRD)South SudanSpainSri LankaSt. Kitts and NevisSt. LuciaSt. Vincent and the GrenadinesSub-Saharan Africa Sub-Saharan Africa (excluding high income)Sub-Saharan Africa (IDA & IBRD countries)SudanSurinameSwazilandSwedenSwitzerlandSyrian Arab RepublicTajikistanTanzaniaThailandTimor-LesteTogoTongaTrinidad and TobagoTunisiaTurkeyTurkmenistanTurks and Caicos IslandsTuvaluUgandaUkraineUnited Arab EmiratesUnited KingdomUnited StatesUpper middle incomeUruguayUzbekistanVanuatuVenezuela, RBVietnamWest Bank and GazaWorldYemen, Rep.ZambiaZimbabwe Timeline:
This timeline shows a graph from 1971 to 2015 of Kiribati. No data until 1970. Number of actual observations by date: 40.
Source name:
World Development Indicators
Source organization:
UNESCO Institute for Statistics
Categories, topics:
Education, Gender
Last updated:
apr 23, 2017
Indicators value changes by year
Minimum:
41.176
jan 1, 1972
Maximum:
55.433
jan 1, 2015
At the date of observation
Value
Absolute change
Change from previous value
jan 1, 1971
42.444
+42.444
0.0%
jan 1, 1972
41.176
-1.267
-2.99%
jan 1, 1973
41.193
+0.017
0.04%
jan 1, 1974
43.808
+2.615
6.35%
jan 1, 1975
46.951
+3.143
7.17%
jan 1, 1976
47.547
+0.596
1.27%
jan 1, 1977
48.444
+0.897
1.89%
jan 1, 1978
49.038
+0.595
1.23%
jan 1, 1979
50.524
+1.485
3.03%
jan 1, 1980
51.109
+0.585
1.16%
jan 1, 1981
51.202
+0.093
0.18%
jan 1, 1982
53.422
+2.22
4.34%
jan 1, 1983
51.789
-1.632
-3.06%
jan 1, 1984
51.566
-0.224
-0.43%
jan 1, 1985
49.819
-1.747
-3.39%
jan 1, 1986
51.079
+1.26
2.53%
jan 1, 1987
51.627
+0.549
1.07%
jan 1, 1988
50.543
-1.085
-2.1%
jan 1, 1989
51.666
+1.123
2.22%
jan 1, 1990
52.464
+0.798
1.54%
jan 1, 1991
51.567
-0.897
-1.71%
jan 1, 1992
53.56
+1.993
3.87%
jan 1, 1993
52.167
-1.393
-2.6%
jan 1, 1994
53.553
+1.386
2.66%
jan 1, 1995
52.375
-1.178
-2.2%
jan 1, 1996
54.304
+1.928
3.68%
jan 1, 1997
53.666
-0.637
-1.17%
jan 1, 1998
53.032
-0.634
-1.18%
jan 1, 1999
51.607
-1.425
-2.69%
jan 1, 2000
54.355
+2.748
5.33%
jan 1, 2001
55.009
+0.654
1.2%
jan 1, 2002
53.157
-1.852
-3.37%
jan 1, 2003
52.497
-0.66
-1.24%
jan 1, 2004
52.911
+0.414
0.79%
jan 1, 2005
52.837
-0.074
-0.14%
jan 1, 2006
51.823
-1.014
-1.92%
jan 1, 2007
52.811
+0.988
1.91%
jan 1, 2008
52.657
-0.154
-0.29%
jan 1, 2009
51.204
-1.453
-2.76%
jan 1, 2015
55.433
+4.229
8.26%
Ranking of countries by current statistics by years


Comments: