29
/
en
AIzaSyAYiBZKx7MnpbEhh9jyipgxe19OcubqV5w
April 1, 2024
214679
Norway
NOR
true
2
1
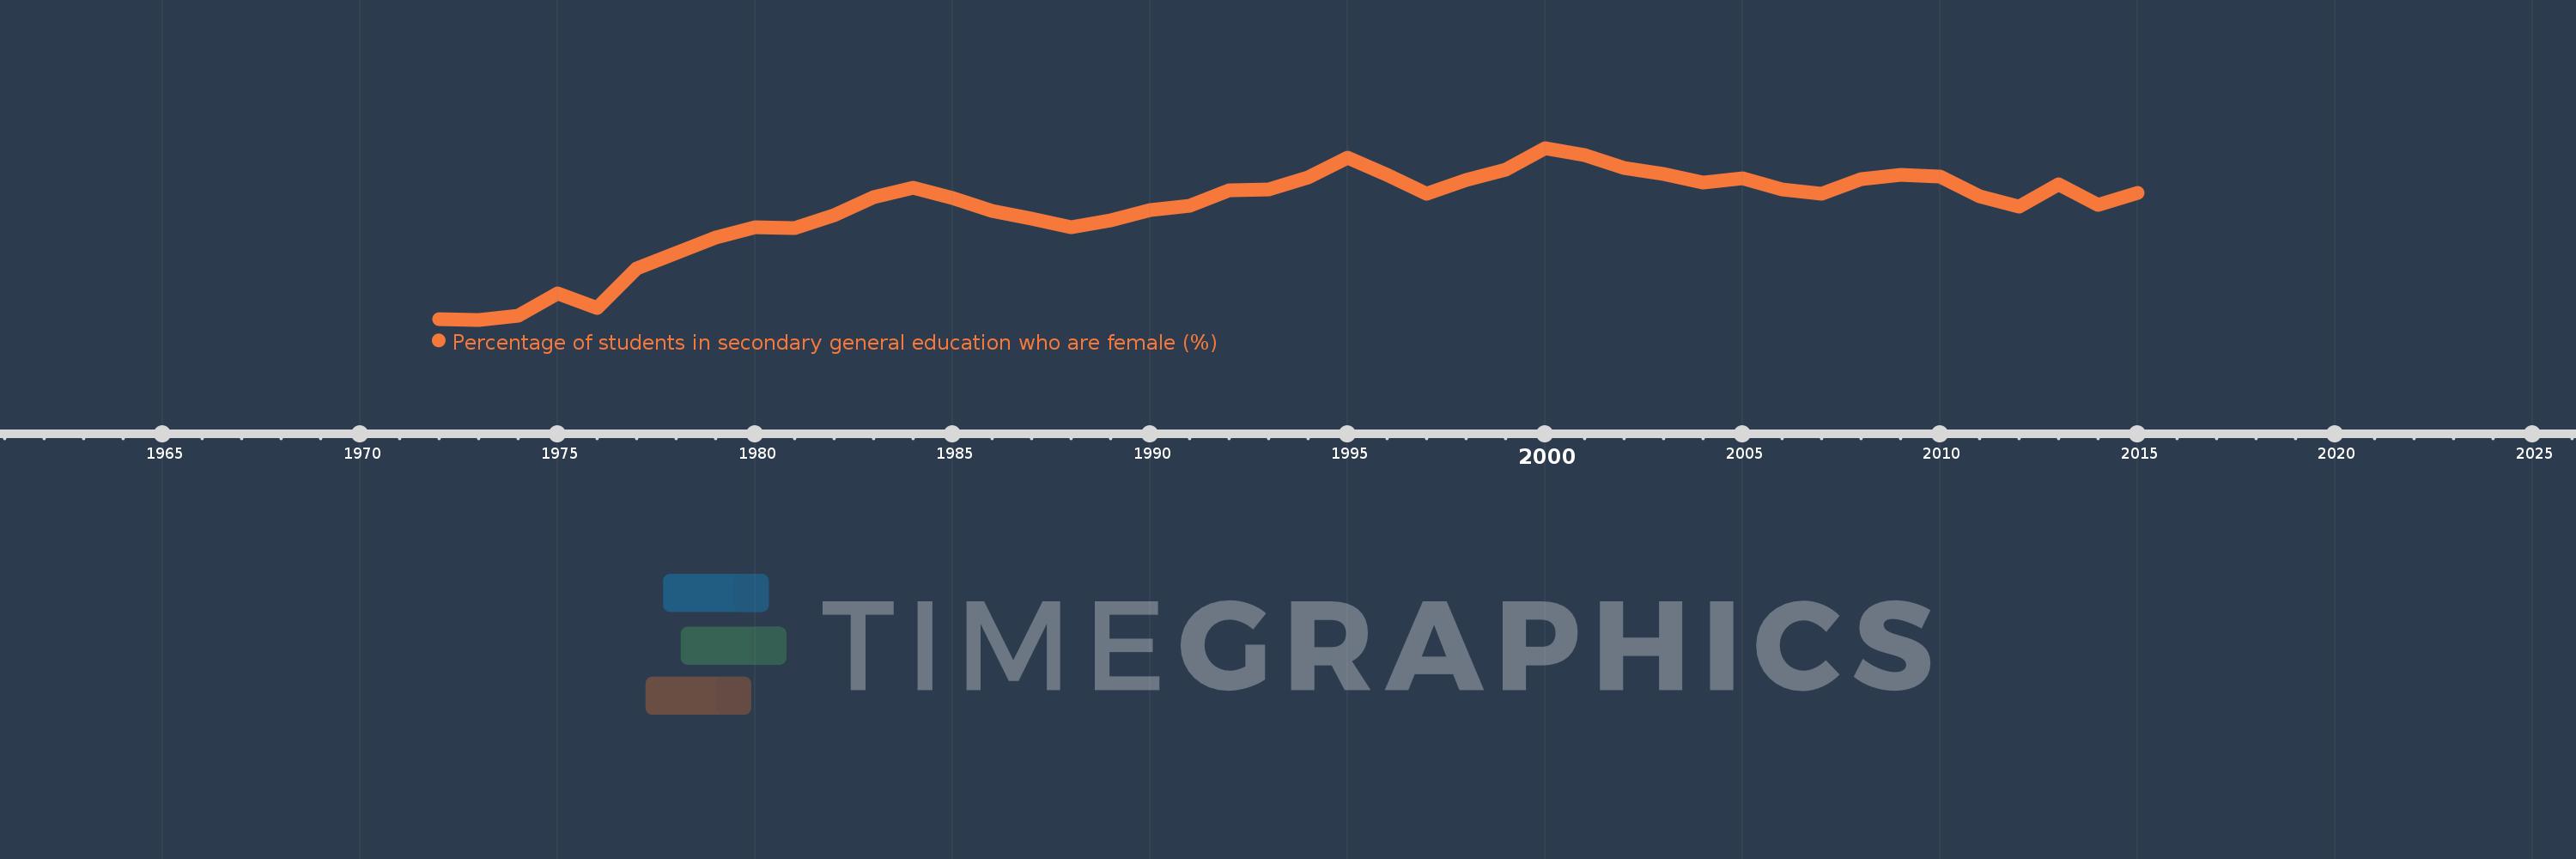
Percentage of students in secondary general education who are female (%)
2015,2014,2013,2012,2011,2010,2009,2008,2007,2006,2005,2004,2003,2002,2001,2000,1999,1998,1997,1996,1995,1994,1993,1992,1991,1990,1989,1988,1987,1986,1985,1984,1983,1982,1981,1980,1979,1978,1977,1976,1975,1974,1973,1972
This statistics in other country:
AfghanistanAlbaniaAlgeriaAndorraAngolaAntigua and BarbudaArab WorldArgentinaArmeniaArubaAustraliaAustriaAzerbaijanBahamas, TheBahrainBangladeshBarbadosBelarusBelgiumBelizeBeninBermudaBhutanBoliviaBosnia and HerzegovinaBotswanaBrazilBritish Virgin IslandsBrunei DarussalamBulgariaBurkina FasoBurundiCabo VerdeCambodiaCameroonCanadaCaribbean small statesCayman IslandsCentral African RepublicCentral Europe and the BalticsChadChileChinaColombiaComorosCongo, Dem. Rep.Congo, Rep.Costa RicaCote d'IvoireCroatiaCubaCuracaoCyprusCzech RepublicDenmarkDjiboutiDominicaDominican RepublicEarly-demographic dividendEast Asia & PacificEast Asia & Pacific (excluding high income)East Asia & Pacific (IDA & IBRD countries)EcuadorEgypt, Arab Rep.El SalvadorEquatorial GuineaEritreaEstoniaEthiopiaEuro areaEurope & Central AsiaEurope & Central Asia (excluding high income)Europe & Central Asia (IDA & IBRD countries)European UnionFijiFinlandFragile and conflict affected situationsFranceGabonGambia, TheGeorgiaGermanyGhanaGibraltarGreeceGrenadaGuatemalaGuineaGuinea-BissauGuyanaHaitiHeavily indebted poor countries (HIPC)High incomeHondurasHong Kong SAR, ChinaHungaryIBRD onlyIcelandIDA & IBRD totalIDA blendIDA onlyIDA totalIndiaIndonesiaIran, Islamic Rep.IraqIrelandIsraelItalyJamaicaJapanJordanKazakhstanKenyaKiribatiKorea, Dem. People’s Rep.Korea, Rep.KuwaitKyrgyz RepublicLao PDRLate-demographic dividendLatin America & Caribbean Latin America & Caribbean (excluding high income)Latin America & the Caribbean (IDA & IBRD countries)LatviaLeast developed countries: UN classificationLebanonLesothoLiberiaLibyaLiechtensteinLithuaniaLow & middle incomeLow incomeLower middle incomeLuxembourgMacao SAR, ChinaMacedonia, FYRMadagascarMalawiMalaysiaMaldivesMaliMaltaMarshall IslandsMauritaniaMauritiusMexicoMicronesia, Fed. Sts.Middle East & North AfricaMiddle East & North Africa (excluding high income)Middle East & North Africa (IDA & IBRD countries)Middle incomeMoldovaMonacoMongoliaMontenegroMoroccoMozambiqueMyanmarNamibiaNauruNepalNetherlandsNew ZealandNicaraguaNigerNigeriaNorth AmericaNorwayOECD membersOmanOther small statesPacific island small statesPakistanPalauPanamaPapua New GuineaParaguayPeruPhilippinesPolandPortugalPost-demographic dividendPre-demographic dividendPuerto RicoQatarRomaniaRussian FederationRwandaSamoaSan MarinoSao Tome and PrincipeSaudi ArabiaSenegalSerbiaSeychellesSierra LeoneSingaporeSint Maarten (Dutch part)Slovak RepublicSloveniaSmall statesSolomon IslandsSomaliaSouth AfricaSouth AsiaSouth Asia (IDA & IBRD)South SudanSpainSri LankaSt. Kitts and NevisSt. LuciaSt. Vincent and the GrenadinesSub-Saharan Africa Sub-Saharan Africa (excluding high income)Sub-Saharan Africa (IDA & IBRD countries)SudanSurinameSwazilandSwedenSwitzerlandSyrian Arab RepublicTajikistanTanzaniaThailandTimor-LesteTogoTongaTrinidad and TobagoTunisiaTurkeyTurkmenistanTurks and Caicos IslandsTuvaluUgandaUkraineUnited Arab EmiratesUnited KingdomUnited StatesUpper middle incomeUruguayUzbekistanVanuatuVenezuela, RBVietnamWest Bank and GazaWorldYemen, Rep.ZambiaZimbabwe Timeline:
This timeline shows a graph from 1972 to 2015 of Norway. No data until 1971. Number of actual observations by date: 44.
Source name:
World Development Indicators
Source organization:
UNESCO Institute for Statistics
Categories, topics:
Education, Gender
Last updated:
apr 23, 2017
Indicators value changes by year
Minimum:
49.243
jan 1, 1973
At the date of observation
Value
Absolute change
Change from previous value
jan 1, 1972
49.257
+49.257
0.0%
jan 1, 1973
49.243
-0.014
-0.03%
jan 1, 1974
49.299
+0.056
0.11%
jan 1, 1975
49.642
+0.343
0.7%
jan 1, 1976
49.415
-0.227
-0.46%
jan 1, 1977
50.01
+0.595
1.2%
jan 1, 1978
50.249
+0.239
0.48%
jan 1, 1979
50.481
+0.231
0.46%
jan 1, 1980
50.631
+0.15
0.3%
jan 1, 1981
50.619
-0.011
-0.02%
jan 1, 1982
50.807
+0.188
0.37%
jan 1, 1983
51.085
+0.277
0.55%
jan 1, 1984
51.228
+0.143
0.28%
jan 1, 1985
51.068
-0.16
-0.31%
jan 1, 1986
50.873
-0.196
-0.38%
jan 1, 1987
50.762
-0.111
-0.22%
jan 1, 1988
50.633
-0.129
-0.25%
jan 1, 1989
50.732
+0.099
0.2%
jan 1, 1990
50.891
+0.158
0.31%
jan 1, 1991
50.956
+0.066
0.13%
jan 1, 1992
51.18
+0.224
0.44%
jan 1, 1993
51.202
+0.022
0.04%
jan 1, 1994
51.373
+0.171
0.33%
jan 1, 1995
51.68
+0.307
0.6%
jan 1, 1996
51.415
-0.265
-0.51%
jan 1, 1997
51.131
-0.284
-0.55%
jan 1, 1998
51.335
+0.204
0.4%
jan 1, 1999
51.488
+0.153
0.3%
jan 1, 2000
51.82
+0.332
0.64%
jan 1, 2001
51.717
-0.103
-0.2%
jan 1, 2002
51.522
-0.195
-0.38%
jan 1, 2003
51.434
-0.088
-0.17%
jan 1, 2004
51.307
-0.127
-0.25%
jan 1, 2005
51.368
+0.061
0.12%
jan 1, 2006
51.192
-0.175
-0.34%
jan 1, 2007
51.138
-0.055
-0.11%
jan 1, 2008
51.353
+0.216
0.42%
jan 1, 2009
51.418
+0.065
0.13%
jan 1, 2010
51.39
-0.029
-0.06%
jan 1, 2011
51.097
-0.292
-0.57%
jan 1, 2012
50.939
-0.158
-0.31%
jan 1, 2013
51.277
+0.337
0.66%
jan 1, 2014
50.964
-0.312
-0.61%
jan 1, 2015
51.14
+0.176
0.34%
Ranking of countries by current statistics by years


Comments: