29
/
en
AIzaSyAYiBZKx7MnpbEhh9jyipgxe19OcubqV5w
April 1, 2024
226281
Portugal
PRT
true
2
1
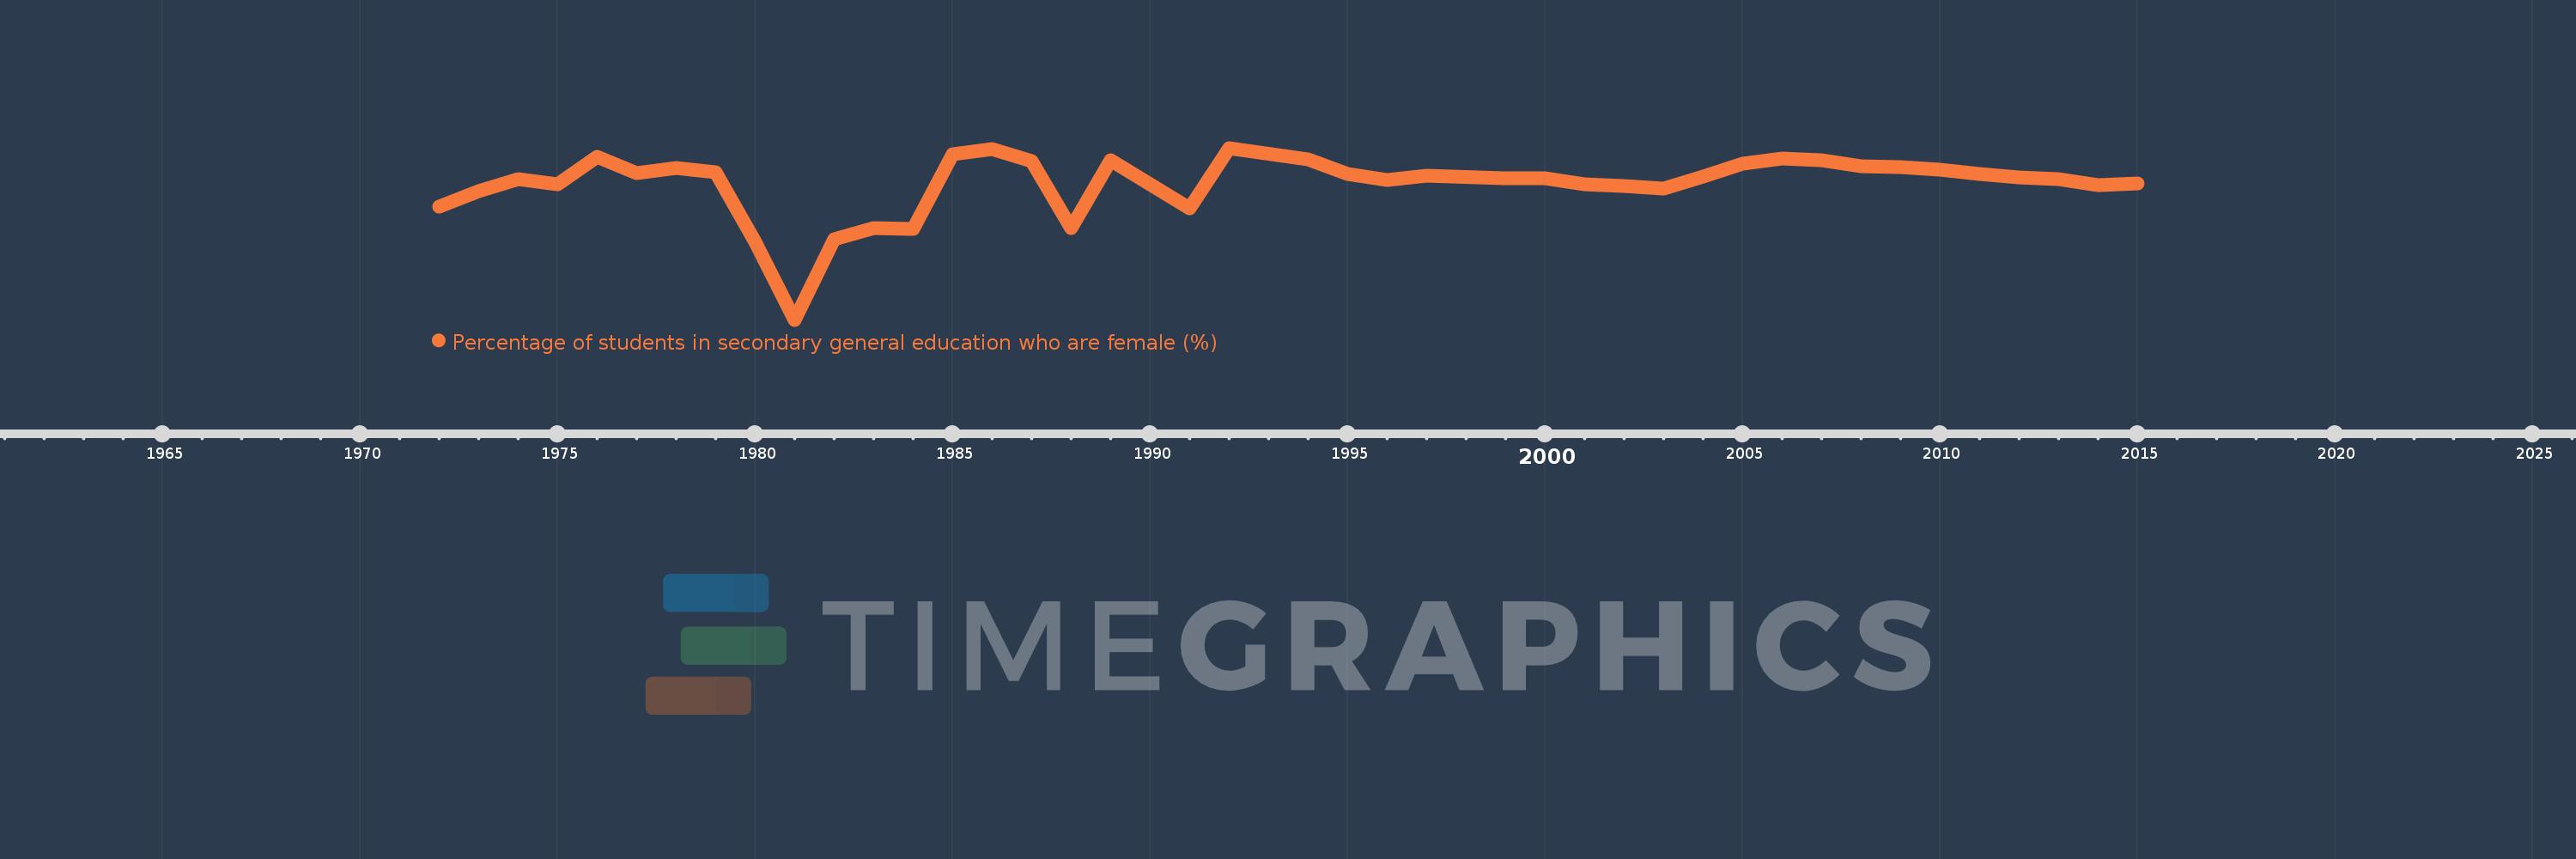
Percentage of students in secondary general education who are female (%)
2015,2014,2013,2012,2011,2010,2009,2008,2007,2006,2005,2004,2003,2002,2001,2000,1999,1997,1996,1995,1994,1992,1991,1989,1988,1987,1986,1985,1984,1983,1982,1981,1980,1979,1978,1977,1976,1975,1974,1973,1972
This statistics in other country:
AfghanistanAlbaniaAlgeriaAndorraAngolaAntigua and BarbudaArab WorldArgentinaArmeniaArubaAustraliaAustriaAzerbaijanBahamas, TheBahrainBangladeshBarbadosBelarusBelgiumBelizeBeninBermudaBhutanBoliviaBosnia and HerzegovinaBotswanaBrazilBritish Virgin IslandsBrunei DarussalamBulgariaBurkina FasoBurundiCabo VerdeCambodiaCameroonCanadaCaribbean small statesCayman IslandsCentral African RepublicCentral Europe and the BalticsChadChileChinaColombiaComorosCongo, Dem. Rep.Congo, Rep.Costa RicaCote d'IvoireCroatiaCubaCuracaoCyprusCzech RepublicDenmarkDjiboutiDominicaDominican RepublicEarly-demographic dividendEast Asia & PacificEast Asia & Pacific (excluding high income)East Asia & Pacific (IDA & IBRD countries)EcuadorEgypt, Arab Rep.El SalvadorEquatorial GuineaEritreaEstoniaEthiopiaEuro areaEurope & Central AsiaEurope & Central Asia (excluding high income)Europe & Central Asia (IDA & IBRD countries)European UnionFijiFinlandFragile and conflict affected situationsFranceGabonGambia, TheGeorgiaGermanyGhanaGibraltarGreeceGrenadaGuatemalaGuineaGuinea-BissauGuyanaHaitiHeavily indebted poor countries (HIPC)High incomeHondurasHong Kong SAR, ChinaHungaryIBRD onlyIcelandIDA & IBRD totalIDA blendIDA onlyIDA totalIndiaIndonesiaIran, Islamic Rep.IraqIrelandIsraelItalyJamaicaJapanJordanKazakhstanKenyaKiribatiKorea, Dem. People’s Rep.Korea, Rep.KuwaitKyrgyz RepublicLao PDRLate-demographic dividendLatin America & Caribbean Latin America & Caribbean (excluding high income)Latin America & the Caribbean (IDA & IBRD countries)LatviaLeast developed countries: UN classificationLebanonLesothoLiberiaLibyaLiechtensteinLithuaniaLow & middle incomeLow incomeLower middle incomeLuxembourgMacao SAR, ChinaMacedonia, FYRMadagascarMalawiMalaysiaMaldivesMaliMaltaMarshall IslandsMauritaniaMauritiusMexicoMicronesia, Fed. Sts.Middle East & North AfricaMiddle East & North Africa (excluding high income)Middle East & North Africa (IDA & IBRD countries)Middle incomeMoldovaMonacoMongoliaMontenegroMoroccoMozambiqueMyanmarNamibiaNauruNepalNetherlandsNew ZealandNicaraguaNigerNigeriaNorth AmericaNorwayOECD membersOmanOther small statesPacific island small statesPakistanPalauPanamaPapua New GuineaParaguayPeruPhilippinesPolandPortugalPost-demographic dividendPre-demographic dividendPuerto RicoQatarRomaniaRussian FederationRwandaSamoaSan MarinoSao Tome and PrincipeSaudi ArabiaSenegalSerbiaSeychellesSierra LeoneSingaporeSint Maarten (Dutch part)Slovak RepublicSloveniaSmall statesSolomon IslandsSomaliaSouth AfricaSouth AsiaSouth Asia (IDA & IBRD)South SudanSpainSri LankaSt. Kitts and NevisSt. LuciaSt. Vincent and the GrenadinesSub-Saharan Africa Sub-Saharan Africa (excluding high income)Sub-Saharan Africa (IDA & IBRD countries)SudanSurinameSwazilandSwedenSwitzerlandSyrian Arab RepublicTajikistanTanzaniaThailandTimor-LesteTogoTongaTrinidad and TobagoTunisiaTurkeyTurkmenistanTurks and Caicos IslandsTuvaluUgandaUkraineUnited Arab EmiratesUnited KingdomUnited StatesUpper middle incomeUruguayUzbekistanVanuatuVenezuela, RBVietnamWest Bank and GazaWorldYemen, Rep.ZambiaZimbabwe Timeline:
This timeline shows a graph from 1972 to 2015 of Portugal. No data until 1971. Number of actual observations by date: 41.
Source name:
World Development Indicators
Source organization:
UNESCO Institute for Statistics
Categories, topics:
Education, Gender
Last updated:
apr 23, 2017
Indicators value changes by year
Minimum:
42.636
jan 1, 1981
Maximum:
53.737
jan 1, 1992
At the date of observation
Value
Absolute change
Change from previous value
jan 1, 1972
49.959
+49.959
0.0%
jan 1, 1973
50.949
+0.991
1.98%
jan 1, 1974
51.701
+0.752
1.48%
jan 1, 1975
51.392
-0.309
-0.6%
jan 1, 1976
53.169
+1.777
3.46%
jan 1, 1977
52.104
-1.064
-2.0%
jan 1, 1978
52.448
+0.343
0.66%
jan 1, 1979
52.144
-0.304
-0.58%
jan 1, 1980
47.686
-4.458
-8.55%
jan 1, 1981
42.636
-5.051
-10.59%
jan 1, 1982
47.854
+5.218
12.24%
jan 1, 1983
48.535
+0.681
1.42%
jan 1, 1984
48.507
-0.028
-0.06%
jan 1, 1985
53.344
+4.838
9.97%
jan 1, 1986
53.648
+0.304
0.57%
jan 1, 1987
52.875
-0.773
-1.44%
jan 1, 1988
48.574
-4.301
-8.13%
jan 1, 1989
52.966
+4.392
9.04%
jan 1, 1991
49.816
-3.15
-5.95%
jan 1, 1992
53.737
+3.921
7.87%
jan 1, 1994
53.023
-0.714
-1.33%
jan 1, 1995
52.035
-0.987
-1.86%
jan 1, 1996
51.644
-0.392
-0.75%
jan 1, 1997
51.953
+0.309
0.6%
jan 1, 1999
51.775
-0.178
-0.34%
jan 1, 2000
51.798
+0.024
0.05%
jan 1, 2001
51.365
-0.433
-0.84%
jan 1, 2002
51.265
-0.1
-0.19%
jan 1, 2003
51.108
-0.157
-0.31%
jan 1, 2004
51.873
+0.765
1.5%
jan 1, 2005
52.745
+0.872
1.68%
jan 1, 2006
53.028
+0.283
0.54%
jan 1, 2007
52.918
-0.109
-0.21%
jan 1, 2008
52.545
-0.373
-0.7%
jan 1, 2009
52.483
-0.062
-0.12%
jan 1, 2010
52.306
-0.177
-0.34%
jan 1, 2011
52.034
-0.272
-0.52%
jan 1, 2012
51.826
-0.208
-0.4%
jan 1, 2013
51.719
-0.107
-0.21%
jan 1, 2014
51.337
-0.382
-0.74%
jan 1, 2015
51.444
+0.107
0.21%
Ranking of countries by current statistics by years


Comments: