29
/
en
AIzaSyAYiBZKx7MnpbEhh9jyipgxe19OcubqV5w
April 1, 2024
65195
Albania
ALB
true
2
1
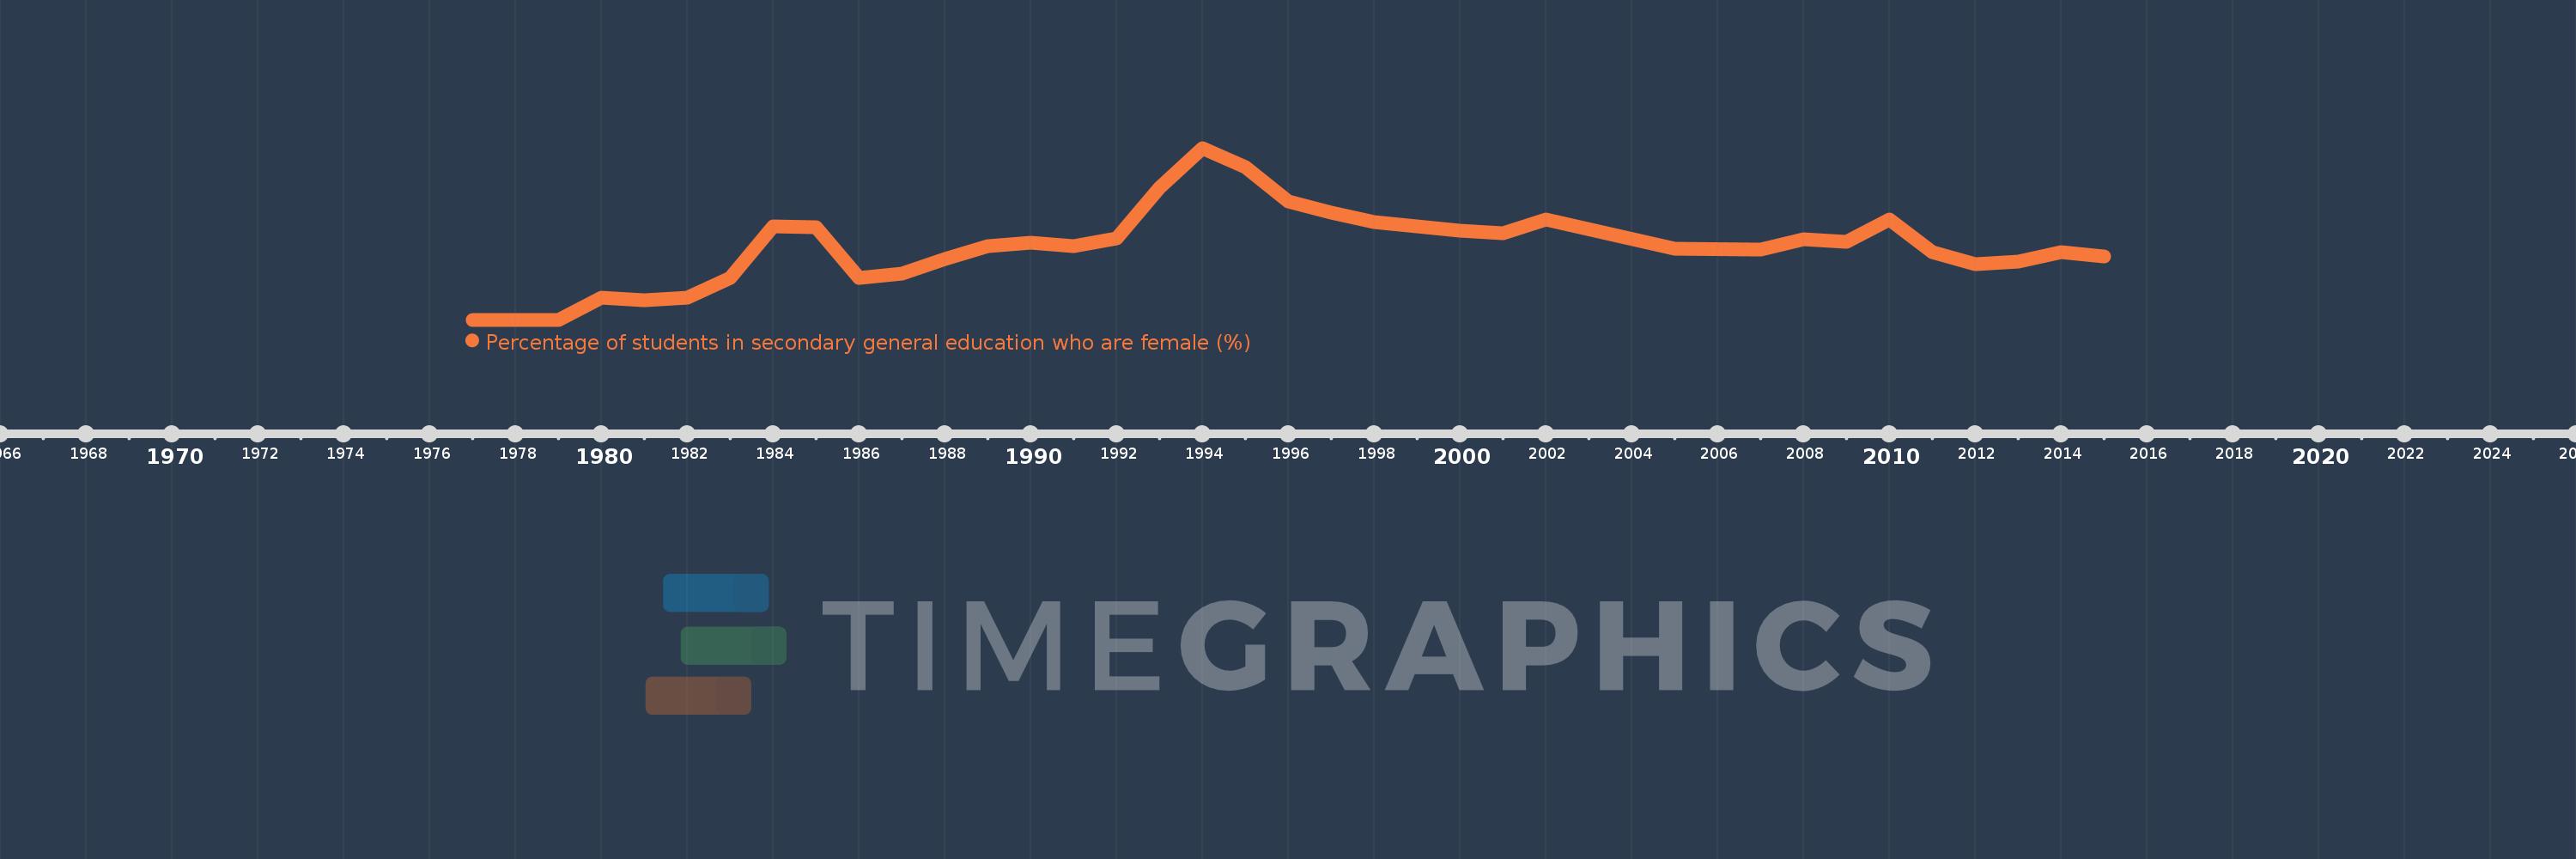
Percentage of students in secondary general education who are female (%)
2015,2014,2013,2012,2011,2010,2009,2008,2007,2005,2002,2001,2000,1998,1997,1996,1995,1994,1993,1992,1991,1990,1989,1988,1987,1986,1985,1984,1983,1982,1981,1980,1979,1977
This statistics in other country:
AfghanistanAlbaniaAlgeriaAndorraAngolaAntigua and BarbudaArab WorldArgentinaArmeniaArubaAustraliaAustriaAzerbaijanBahamas, TheBahrainBangladeshBarbadosBelarusBelgiumBelizeBeninBermudaBhutanBoliviaBosnia and HerzegovinaBotswanaBrazilBritish Virgin IslandsBrunei DarussalamBulgariaBurkina FasoBurundiCabo VerdeCambodiaCameroonCanadaCaribbean small statesCayman IslandsCentral African RepublicCentral Europe and the BalticsChadChileChinaColombiaComorosCongo, Dem. Rep.Congo, Rep.Costa RicaCote d'IvoireCroatiaCubaCuracaoCyprusCzech RepublicDenmarkDjiboutiDominicaDominican RepublicEarly-demographic dividendEast Asia & PacificEast Asia & Pacific (excluding high income)East Asia & Pacific (IDA & IBRD countries)EcuadorEgypt, Arab Rep.El SalvadorEquatorial GuineaEritreaEstoniaEthiopiaEuro areaEurope & Central AsiaEurope & Central Asia (excluding high income)Europe & Central Asia (IDA & IBRD countries)European UnionFijiFinlandFragile and conflict affected situationsFranceGabonGambia, TheGeorgiaGermanyGhanaGibraltarGreeceGrenadaGuatemalaGuineaGuinea-BissauGuyanaHaitiHeavily indebted poor countries (HIPC)High incomeHondurasHong Kong SAR, ChinaHungaryIBRD onlyIcelandIDA & IBRD totalIDA blendIDA onlyIDA totalIndiaIndonesiaIran, Islamic Rep.IraqIrelandIsraelItalyJamaicaJapanJordanKazakhstanKenyaKiribatiKorea, Dem. People’s Rep.Korea, Rep.KuwaitKyrgyz RepublicLao PDRLate-demographic dividendLatin America & Caribbean Latin America & Caribbean (excluding high income)Latin America & the Caribbean (IDA & IBRD countries)LatviaLeast developed countries: UN classificationLebanonLesothoLiberiaLibyaLiechtensteinLithuaniaLow & middle incomeLow incomeLower middle incomeLuxembourgMacao SAR, ChinaMacedonia, FYRMadagascarMalawiMalaysiaMaldivesMaliMaltaMarshall IslandsMauritaniaMauritiusMexicoMicronesia, Fed. Sts.Middle East & North AfricaMiddle East & North Africa (excluding high income)Middle East & North Africa (IDA & IBRD countries)Middle incomeMoldovaMonacoMongoliaMontenegroMoroccoMozambiqueMyanmarNamibiaNauruNepalNetherlandsNew ZealandNicaraguaNigerNigeriaNorth AmericaNorwayOECD membersOmanOther small statesPacific island small statesPakistanPalauPanamaPapua New GuineaParaguayPeruPhilippinesPolandPortugalPost-demographic dividendPre-demographic dividendPuerto RicoQatarRomaniaRussian FederationRwandaSamoaSan MarinoSao Tome and PrincipeSaudi ArabiaSenegalSerbiaSeychellesSierra LeoneSingaporeSint Maarten (Dutch part)Slovak RepublicSloveniaSmall statesSolomon IslandsSomaliaSouth AfricaSouth AsiaSouth Asia (IDA & IBRD)South SudanSpainSri LankaSt. Kitts and NevisSt. LuciaSt. Vincent and the GrenadinesSub-Saharan Africa Sub-Saharan Africa (excluding high income)Sub-Saharan Africa (IDA & IBRD countries)SudanSurinameSwazilandSwedenSwitzerlandSyrian Arab RepublicTajikistanTanzaniaThailandTimor-LesteTogoTongaTrinidad and TobagoTunisiaTurkeyTurkmenistanTurks and Caicos IslandsTuvaluUgandaUkraineUnited Arab EmiratesUnited KingdomUnited StatesUpper middle incomeUruguayUzbekistanVanuatuVenezuela, RBVietnamWest Bank and GazaWorldYemen, Rep.ZambiaZimbabwe Timeline:
This timeline shows a graph from 1977 to 2015 of Albania. No data until 1976. Number of actual observations by date: 34.
Source name:
World Development Indicators
Source organization:
UNESCO Institute for Statistics
Categories, topics:
Education, Gender
Last updated:
apr 23, 2017
Indicators value changes by year
Minimum:
47.402
jan 1, 1977
Maximum:
50.966
jan 1, 1994
At the date of observation
Value
Absolute change
Change from previous value
jan 1, 1977
47.402
+47.402
0.0%
jan 1, 1979
47.404
+0.002
0.0%
jan 1, 1980
47.866
+0.462
0.98%
jan 1, 1981
47.803
-0.064
-0.13%
jan 1, 1982
47.86
+0.057
0.12%
jan 1, 1983
48.272
+0.412
0.86%
jan 1, 1984
49.338
+1.066
2.21%
jan 1, 1985
49.322
-0.016
-0.03%
jan 1, 1986
48.264
-1.058
-2.15%
jan 1, 1987
48.362
+0.099
0.2%
jan 1, 1988
48.663
+0.301
0.62%
jan 1, 1989
48.937
+0.273
0.56%
jan 1, 1990
48.993
+0.057
0.12%
jan 1, 1991
48.926
-0.067
-0.14%
jan 1, 1992
49.092
+0.166
0.34%
jan 1, 1993
50.133
+1.041
2.12%
jan 1, 1994
50.966
+0.832
1.66%
jan 1, 1995
50.567
-0.399
-0.78%
jan 1, 1996
49.853
-0.713
-1.41%
jan 1, 1997
49.628
-0.225
-0.45%
jan 1, 1998
49.421
-0.208
-0.42%
jan 1, 2000
49.245
-0.175
-0.35%
jan 1, 2001
49.202
-0.044
-0.09%
jan 1, 2002
49.484
+0.282
0.57%
jan 1, 2005
48.873
-0.611
-1.23%
jan 1, 2007
48.855
-0.018
-0.04%
jan 1, 2008
49.079
+0.224
0.46%
jan 1, 2009
49.016
-0.063
-0.13%
jan 1, 2010
49.485
+0.469
0.96%
jan 1, 2011
48.796
-0.689
-1.39%
jan 1, 2012
48.552
-0.243
-0.5%
jan 1, 2013
48.614
+0.061
0.13%
jan 1, 2014
48.81
+0.197
0.4%
jan 1, 2015
48.719
-0.091
-0.19%
Ranking of countries by current statistics by years


Comments: