29
/
en
AIzaSyAYiBZKx7MnpbEhh9jyipgxe19OcubqV5w
April 1, 2024
107738
Colombia
COL
true
2
1
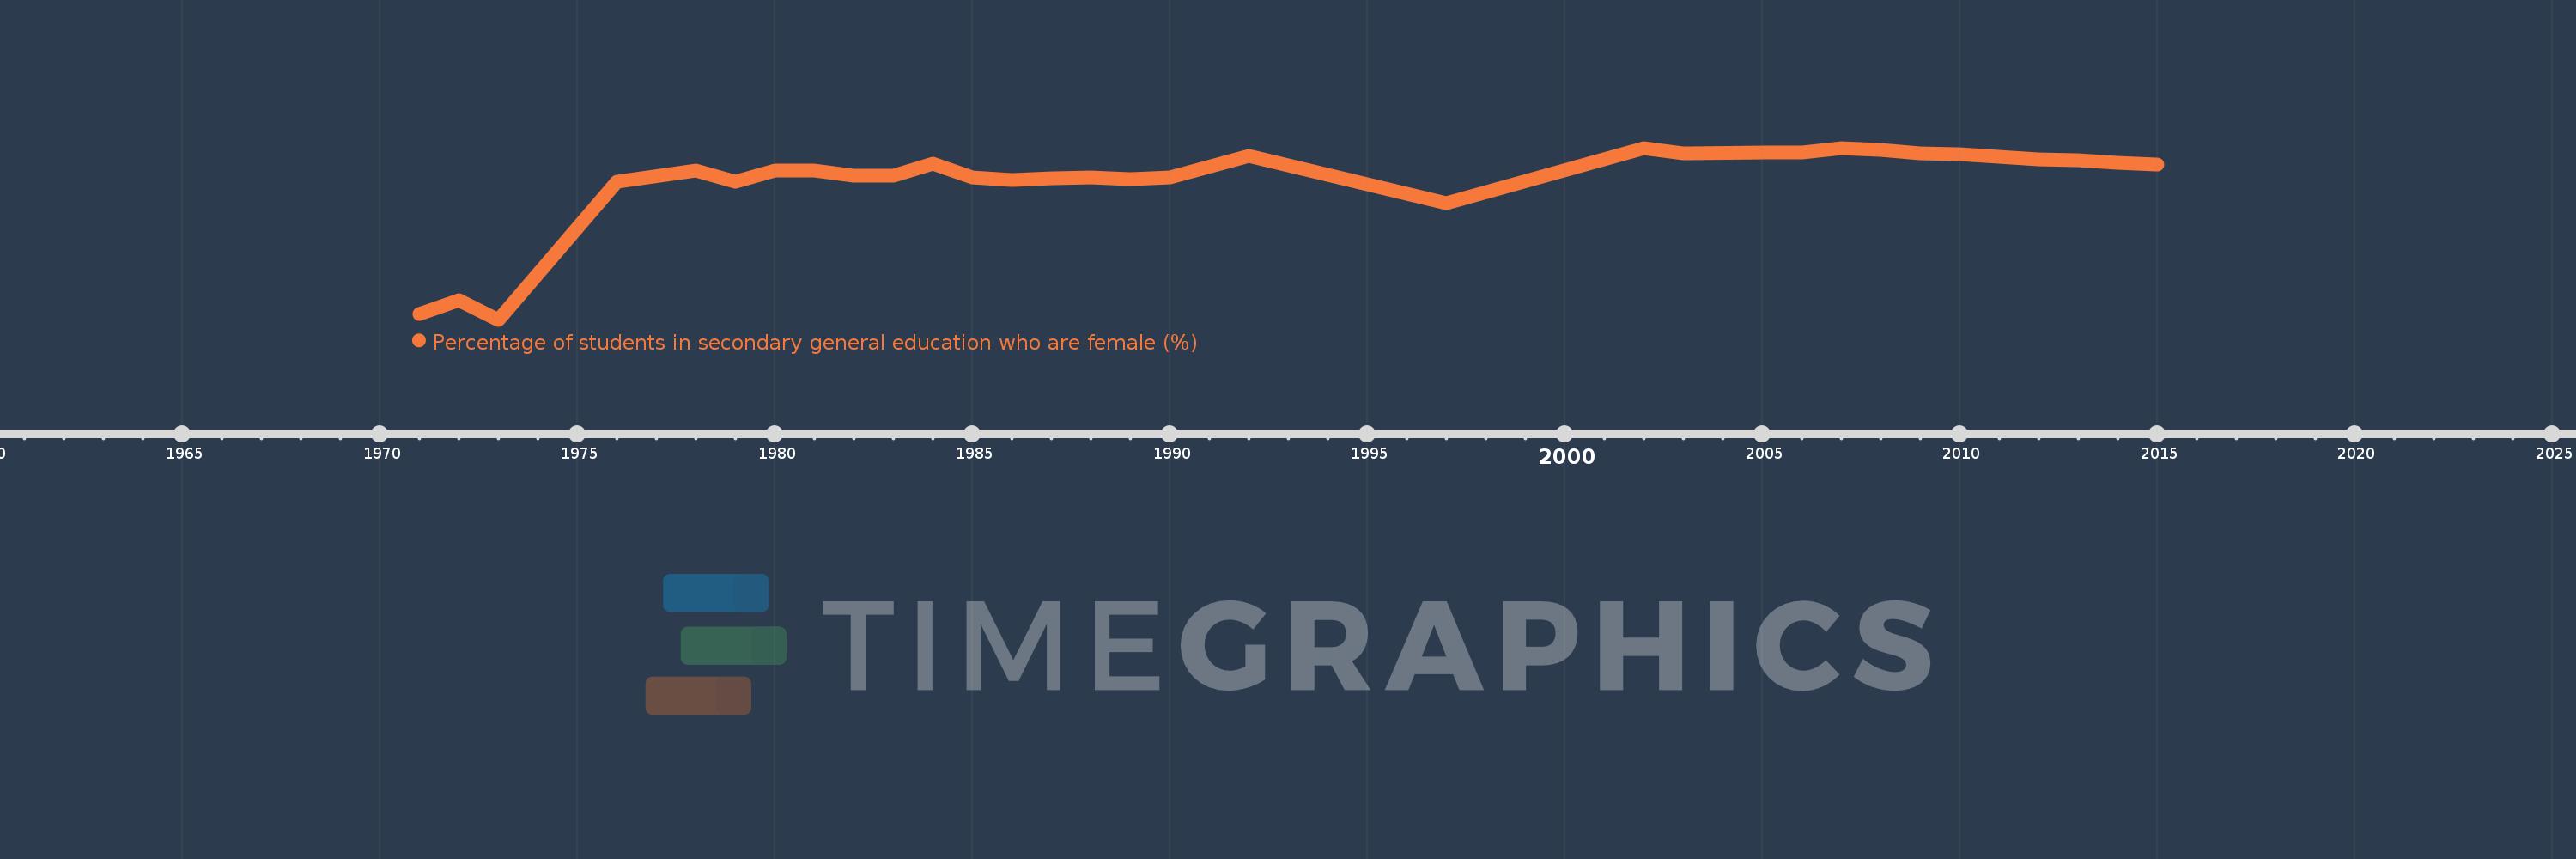
Percentage of students in secondary general education who are female (%)
2015,2014,2013,2012,2011,2010,2009,2008,2007,2006,2005,2003,2002,1997,1992,1990,1989,1988,1987,1986,1985,1984,1983,1982,1981,1980,1979,1978,1976,1973,1972,1971
This statistics in other country:
AfghanistanAlbaniaAlgeriaAndorraAngolaAntigua and BarbudaArab WorldArgentinaArmeniaArubaAustraliaAustriaAzerbaijanBahamas, TheBahrainBangladeshBarbadosBelarusBelgiumBelizeBeninBermudaBhutanBoliviaBosnia and HerzegovinaBotswanaBrazilBritish Virgin IslandsBrunei DarussalamBulgariaBurkina FasoBurundiCabo VerdeCambodiaCameroonCanadaCaribbean small statesCayman IslandsCentral African RepublicCentral Europe and the BalticsChadChileChinaColombiaComorosCongo, Dem. Rep.Congo, Rep.Costa RicaCote d'IvoireCroatiaCubaCuracaoCyprusCzech RepublicDenmarkDjiboutiDominicaDominican RepublicEarly-demographic dividendEast Asia & PacificEast Asia & Pacific (excluding high income)East Asia & Pacific (IDA & IBRD countries)EcuadorEgypt, Arab Rep.El SalvadorEquatorial GuineaEritreaEstoniaEthiopiaEuro areaEurope & Central AsiaEurope & Central Asia (excluding high income)Europe & Central Asia (IDA & IBRD countries)European UnionFijiFinlandFragile and conflict affected situationsFranceGabonGambia, TheGeorgiaGermanyGhanaGibraltarGreeceGrenadaGuatemalaGuineaGuinea-BissauGuyanaHaitiHeavily indebted poor countries (HIPC)High incomeHondurasHong Kong SAR, ChinaHungaryIBRD onlyIcelandIDA & IBRD totalIDA blendIDA onlyIDA totalIndiaIndonesiaIran, Islamic Rep.IraqIrelandIsraelItalyJamaicaJapanJordanKazakhstanKenyaKiribatiKorea, Dem. People’s Rep.Korea, Rep.KuwaitKyrgyz RepublicLao PDRLate-demographic dividendLatin America & Caribbean Latin America & Caribbean (excluding high income)Latin America & the Caribbean (IDA & IBRD countries)LatviaLeast developed countries: UN classificationLebanonLesothoLiberiaLibyaLiechtensteinLithuaniaLow & middle incomeLow incomeLower middle incomeLuxembourgMacao SAR, ChinaMacedonia, FYRMadagascarMalawiMalaysiaMaldivesMaliMaltaMarshall IslandsMauritaniaMauritiusMexicoMicronesia, Fed. Sts.Middle East & North AfricaMiddle East & North Africa (excluding high income)Middle East & North Africa (IDA & IBRD countries)Middle incomeMoldovaMonacoMongoliaMontenegroMoroccoMozambiqueMyanmarNamibiaNauruNepalNetherlandsNew ZealandNicaraguaNigerNigeriaNorth AmericaNorwayOECD membersOmanOther small statesPacific island small statesPakistanPalauPanamaPapua New GuineaParaguayPeruPhilippinesPolandPortugalPost-demographic dividendPre-demographic dividendPuerto RicoQatarRomaniaRussian FederationRwandaSamoaSan MarinoSao Tome and PrincipeSaudi ArabiaSenegalSerbiaSeychellesSierra LeoneSingaporeSint Maarten (Dutch part)Slovak RepublicSloveniaSmall statesSolomon IslandsSomaliaSouth AfricaSouth AsiaSouth Asia (IDA & IBRD)South SudanSpainSri LankaSt. Kitts and NevisSt. LuciaSt. Vincent and the GrenadinesSub-Saharan Africa Sub-Saharan Africa (excluding high income)Sub-Saharan Africa (IDA & IBRD countries)SudanSurinameSwazilandSwedenSwitzerlandSyrian Arab RepublicTajikistanTanzaniaThailandTimor-LesteTogoTongaTrinidad and TobagoTunisiaTurkeyTurkmenistanTurks and Caicos IslandsTuvaluUgandaUkraineUnited Arab EmiratesUnited KingdomUnited StatesUpper middle incomeUruguayUzbekistanVanuatuVenezuela, RBVietnamWest Bank and GazaWorldYemen, Rep.ZambiaZimbabwe Timeline:
This timeline shows a graph from 1971 to 2015 of Colombia. No data until 1970. Number of actual observations by date: 32.
Source name:
World Development Indicators
Source organization:
UNESCO Institute for Statistics
Categories, topics:
Education, Gender
Last updated:
apr 23, 2017
Indicators value changes by year
Maximum:
51.608
jan 1, 2007
At the date of observation
Value
Absolute change
Change from previous value
jan 1, 1971
42.095
+42.095
0.0%
jan 1, 1972
42.873
+0.777
1.85%
jan 1, 1973
41.78
-1.093
-2.55%
jan 1, 1976
49.686
+7.906
18.92%
jan 1, 1978
50.3
+0.614
1.24%
jan 1, 1979
49.7
-0.6
-1.19%
jan 1, 1980
50.3
+0.6
1.21%
jan 1, 1981
50.305
+0.005
0.01%
jan 1, 1982
50.025
-0.279
-0.56%
jan 1, 1983
50.025
+0.0
0.0%
jan 1, 1984
50.693
+0.667
1.33%
jan 1, 1985
49.9
-0.793
-1.56%
jan 1, 1986
49.799
-0.101
-0.2%
jan 1, 1987
49.857
+0.058
0.12%
jan 1, 1988
49.899
+0.042
0.08%
jan 1, 1989
49.848
-0.051
-0.1%
jan 1, 1990
49.927
+0.08
0.16%
jan 1, 1992
51.156
+1.229
2.46%
jan 1, 1997
48.431
-2.725
-5.33%
jan 1, 2002
51.578
+3.148
6.5%
jan 1, 2003
51.31
-0.268
-0.52%
jan 1, 2005
51.343
+0.033
0.06%
jan 1, 2006
51.37
+0.027
0.05%
jan 1, 2007
51.608
+0.238
0.46%
jan 1, 2008
51.505
-0.103
-0.2%
jan 1, 2009
51.287
-0.218
-0.42%
jan 1, 2010
51.242
-0.045
-0.09%
jan 1, 2011
51.115
-0.127
-0.25%
jan 1, 2012
50.968
-0.147
-0.29%
jan 1, 2013
50.928
-0.041
-0.08%
jan 1, 2014
50.759
-0.169
-0.33%
jan 1, 2015
50.683
-0.075
-0.15%
Ranking of countries by current statistics by years


Comments: