29
/
en
AIzaSyAYiBZKx7MnpbEhh9jyipgxe19OcubqV5w
April 1, 2024
254514
Suriname
SUR
true
2
1
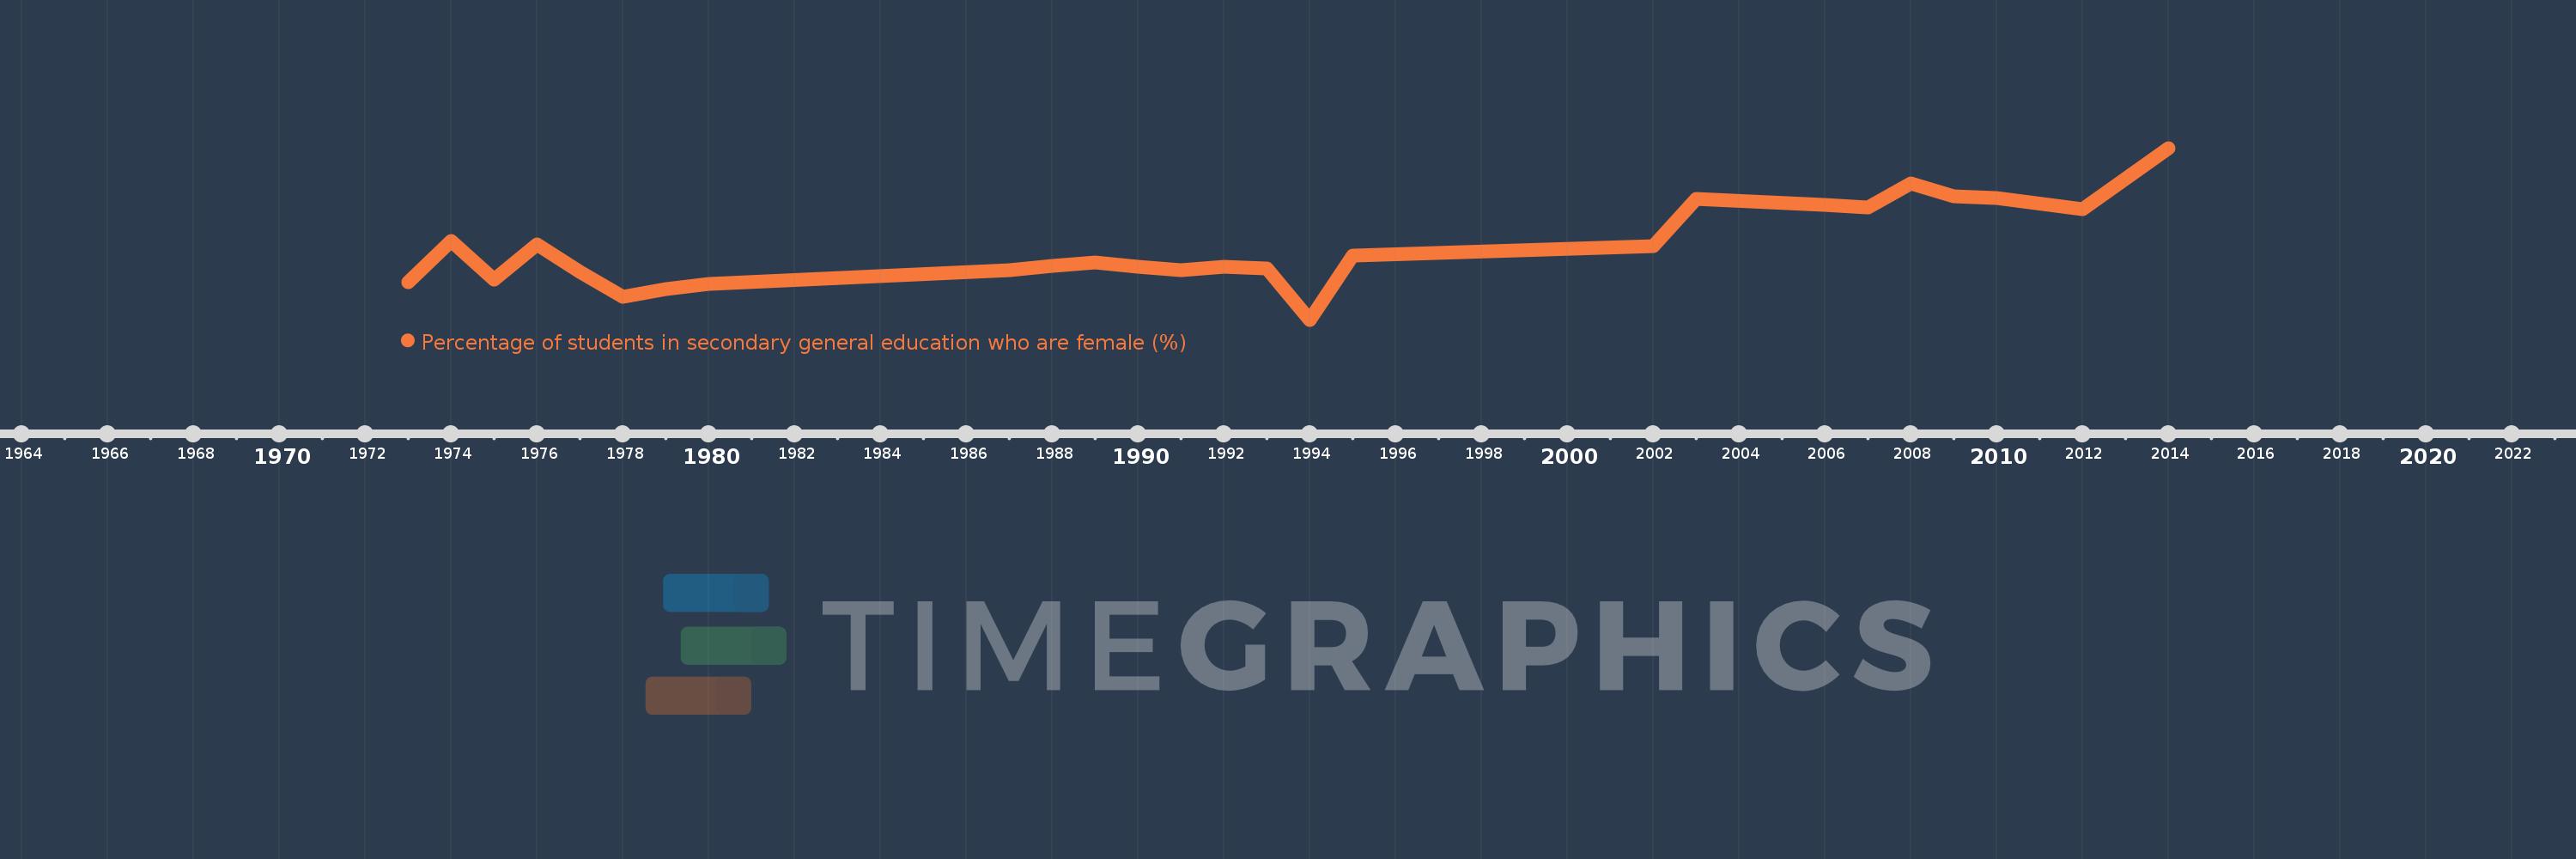
Percentage of students in secondary general education who are female (%)
2014,2012,2010,2009,2008,2007,2006,2003,2002,1995,1994,1993,1992,1991,1990,1989,1988,1987,1980,1979,1978,1977,1976,1975,1974,1973
This statistics in other country:
AfghanistanAlbaniaAlgeriaAndorraAngolaAntigua and BarbudaArab WorldArgentinaArmeniaArubaAustraliaAustriaAzerbaijanBahamas, TheBahrainBangladeshBarbadosBelarusBelgiumBelizeBeninBermudaBhutanBoliviaBosnia and HerzegovinaBotswanaBrazilBritish Virgin IslandsBrunei DarussalamBulgariaBurkina FasoBurundiCabo VerdeCambodiaCameroonCanadaCaribbean small statesCayman IslandsCentral African RepublicCentral Europe and the BalticsChadChileChinaColombiaComorosCongo, Dem. Rep.Congo, Rep.Costa RicaCote d'IvoireCroatiaCubaCuracaoCyprusCzech RepublicDenmarkDjiboutiDominicaDominican RepublicEarly-demographic dividendEast Asia & PacificEast Asia & Pacific (excluding high income)East Asia & Pacific (IDA & IBRD countries)EcuadorEgypt, Arab Rep.El SalvadorEquatorial GuineaEritreaEstoniaEthiopiaEuro areaEurope & Central AsiaEurope & Central Asia (excluding high income)Europe & Central Asia (IDA & IBRD countries)European UnionFijiFinlandFragile and conflict affected situationsFranceGabonGambia, TheGeorgiaGermanyGhanaGibraltarGreeceGrenadaGuatemalaGuineaGuinea-BissauGuyanaHaitiHeavily indebted poor countries (HIPC)High incomeHondurasHong Kong SAR, ChinaHungaryIBRD onlyIcelandIDA & IBRD totalIDA blendIDA onlyIDA totalIndiaIndonesiaIran, Islamic Rep.IraqIrelandIsraelItalyJamaicaJapanJordanKazakhstanKenyaKiribatiKorea, Dem. People’s Rep.Korea, Rep.KuwaitKyrgyz RepublicLao PDRLate-demographic dividendLatin America & Caribbean Latin America & Caribbean (excluding high income)Latin America & the Caribbean (IDA & IBRD countries)LatviaLeast developed countries: UN classificationLebanonLesothoLiberiaLibyaLiechtensteinLithuaniaLow & middle incomeLow incomeLower middle incomeLuxembourgMacao SAR, ChinaMacedonia, FYRMadagascarMalawiMalaysiaMaldivesMaliMaltaMarshall IslandsMauritaniaMauritiusMexicoMicronesia, Fed. Sts.Middle East & North AfricaMiddle East & North Africa (excluding high income)Middle East & North Africa (IDA & IBRD countries)Middle incomeMoldovaMonacoMongoliaMontenegroMoroccoMozambiqueMyanmarNamibiaNauruNepalNetherlandsNew ZealandNicaraguaNigerNigeriaNorth AmericaNorwayOECD membersOmanOther small statesPacific island small statesPakistanPalauPanamaPapua New GuineaParaguayPeruPhilippinesPolandPortugalPost-demographic dividendPre-demographic dividendPuerto RicoQatarRomaniaRussian FederationRwandaSamoaSan MarinoSao Tome and PrincipeSaudi ArabiaSenegalSerbiaSeychellesSierra LeoneSingaporeSint Maarten (Dutch part)Slovak RepublicSloveniaSmall statesSolomon IslandsSomaliaSouth AfricaSouth AsiaSouth Asia (IDA & IBRD)South SudanSpainSri LankaSt. Kitts and NevisSt. LuciaSt. Vincent and the GrenadinesSub-Saharan Africa Sub-Saharan Africa (excluding high income)Sub-Saharan Africa (IDA & IBRD countries)SudanSurinameSwazilandSwedenSwitzerlandSyrian Arab RepublicTajikistanTanzaniaThailandTimor-LesteTogoTongaTrinidad and TobagoTunisiaTurkeyTurkmenistanTurks and Caicos IslandsTuvaluUgandaUkraineUnited Arab EmiratesUnited KingdomUnited StatesUpper middle incomeUruguayUzbekistanVanuatuVenezuela, RBVietnamWest Bank and GazaWorldYemen, Rep.ZambiaZimbabwe Timeline:
This timeline shows a graph from 1973 to 2014 of Suriname. No data until 1972. Number of actual observations by date: 26.
Source name:
World Development Indicators
Source organization:
UNESCO Institute for Statistics
Categories, topics:
Education, Gender
Last updated:
apr 23, 2017
Indicators value changes by year
Minimum:
53.001
jan 1, 1994
Maximum:
64.395
jan 1, 2014
At the date of observation
Value
Absolute change
Change from previous value
jan 1, 1973
55.514
+55.514
0.0%
jan 1, 1974
58.203
+2.689
4.84%
jan 1, 1975
55.683
-2.52
-4.33%
jan 1, 1976
58.012
+2.329
4.18%
jan 1, 1977
56.161
-1.851
-3.19%
jan 1, 1978
54.534
-1.627
-2.9%
jan 1, 1979
55.053
+0.519
0.95%
jan 1, 1980
55.357
+0.304
0.55%
jan 1, 1987
56.285
+0.928
1.68%
jan 1, 1988
56.597
+0.312
0.56%
jan 1, 1989
56.821
+0.224
0.4%
jan 1, 1990
56.511
-0.31
-0.55%
jan 1, 1991
56.309
-0.202
-0.36%
jan 1, 1992
56.502
+0.193
0.34%
jan 1, 1993
56.398
-0.104
-0.18%
jan 1, 1994
53.001
-3.397
-6.02%
jan 1, 1995
57.259
+4.257
8.03%
jan 1, 2002
57.888
+0.629
1.1%
jan 1, 2003
61.041
+3.153
5.45%
jan 1, 2006
60.616
-0.424
-0.7%
jan 1, 2007
60.437
-0.179
-0.29%
jan 1, 2008
62.032
+1.594
2.64%
jan 1, 2009
61.201
-0.831
-1.34%
jan 1, 2010
61.096
-0.105
-0.17%
jan 1, 2012
60.333
-0.763
-1.25%
jan 1, 2014
64.395
+4.061
6.73%
Ranking of countries by current statistics by years


Comments: