29
/
en
AIzaSyAYiBZKx7MnpbEhh9jyipgxe19OcubqV5w
April 1, 2024
42783
Latin America & Caribbean (excluding high income)
LAC
false
2
1
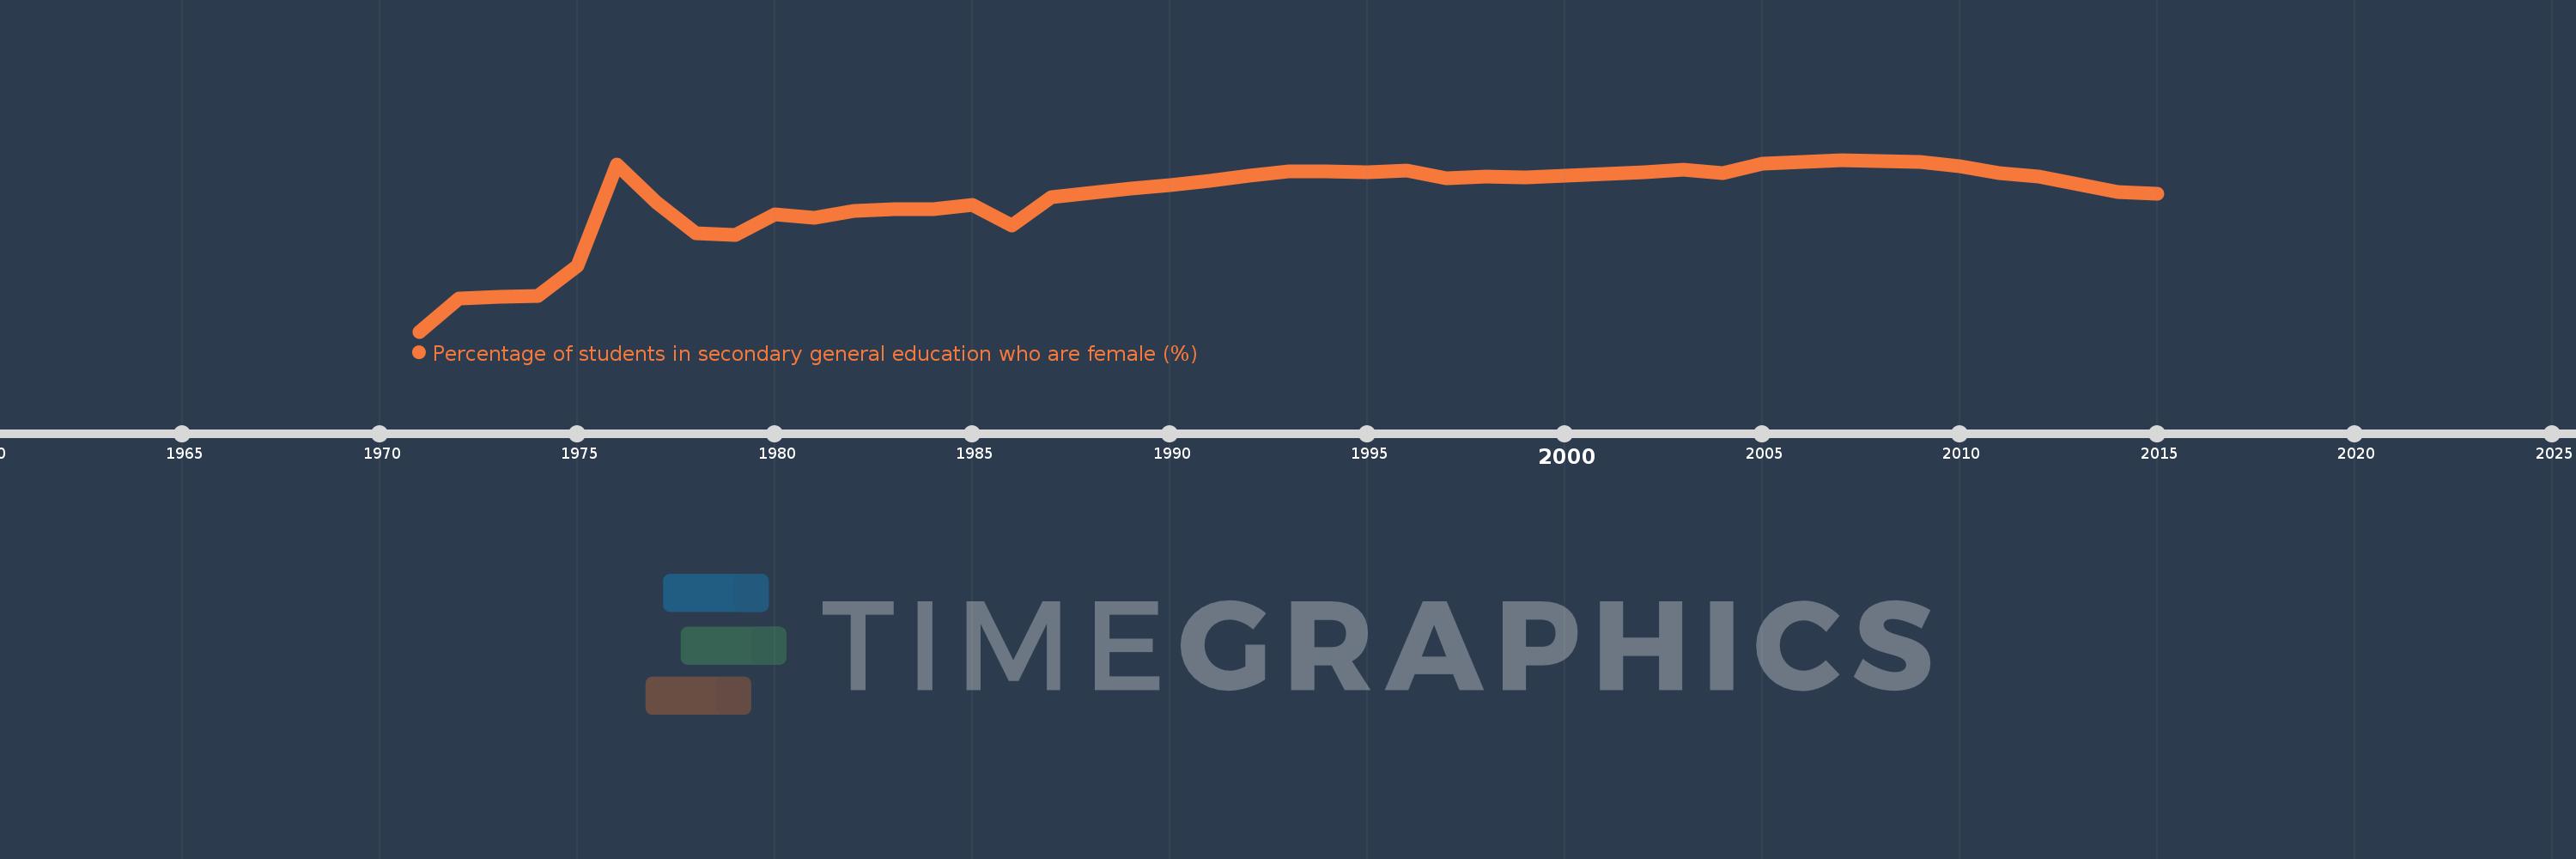
Percentage of students in secondary general education who are female (%)
2015,2014,2013,2012,2011,2010,2009,2008,2007,2006,2005,2004,2003,2002,2001,2000,1999,1998,1997,1996,1995,1994,1993,1992,1991,1990,1989,1988,1987,1986,1985,1984,1983,1982,1981,1980,1979,1978,1977,1976,1975,1974,1973,1972,1971
This statistics in other country:
AfghanistanAlbaniaAlgeriaAndorraAngolaAntigua and BarbudaArab WorldArgentinaArmeniaArubaAustraliaAustriaAzerbaijanBahamas, TheBahrainBangladeshBarbadosBelarusBelgiumBelizeBeninBermudaBhutanBoliviaBosnia and HerzegovinaBotswanaBrazilBritish Virgin IslandsBrunei DarussalamBulgariaBurkina FasoBurundiCabo VerdeCambodiaCameroonCanadaCaribbean small statesCayman IslandsCentral African RepublicCentral Europe and the BalticsChadChileChinaColombiaComorosCongo, Dem. Rep.Congo, Rep.Costa RicaCote d'IvoireCroatiaCubaCuracaoCyprusCzech RepublicDenmarkDjiboutiDominicaDominican RepublicEarly-demographic dividendEast Asia & PacificEast Asia & Pacific (excluding high income)East Asia & Pacific (IDA & IBRD countries)EcuadorEgypt, Arab Rep.El SalvadorEquatorial GuineaEritreaEstoniaEthiopiaEuro areaEurope & Central AsiaEurope & Central Asia (excluding high income)Europe & Central Asia (IDA & IBRD countries)European UnionFijiFinlandFragile and conflict affected situationsFranceGabonGambia, TheGeorgiaGermanyGhanaGibraltarGreeceGrenadaGuatemalaGuineaGuinea-BissauGuyanaHaitiHeavily indebted poor countries (HIPC)High incomeHondurasHong Kong SAR, ChinaHungaryIBRD onlyIcelandIDA & IBRD totalIDA blendIDA onlyIDA totalIndiaIndonesiaIran, Islamic Rep.IraqIrelandIsraelItalyJamaicaJapanJordanKazakhstanKenyaKiribatiKorea, Dem. People’s Rep.Korea, Rep.KuwaitKyrgyz RepublicLao PDRLate-demographic dividendLatin America & Caribbean Latin America & Caribbean (excluding high income)Latin America & the Caribbean (IDA & IBRD countries)LatviaLeast developed countries: UN classificationLebanonLesothoLiberiaLibyaLiechtensteinLithuaniaLow & middle incomeLow incomeLower middle incomeLuxembourgMacao SAR, ChinaMacedonia, FYRMadagascarMalawiMalaysiaMaldivesMaliMaltaMarshall IslandsMauritaniaMauritiusMexicoMicronesia, Fed. Sts.Middle East & North AfricaMiddle East & North Africa (excluding high income)Middle East & North Africa (IDA & IBRD countries)Middle incomeMoldovaMonacoMongoliaMontenegroMoroccoMozambiqueMyanmarNamibiaNauruNepalNetherlandsNew ZealandNicaraguaNigerNigeriaNorth AmericaNorwayOECD membersOmanOther small statesPacific island small statesPakistanPalauPanamaPapua New GuineaParaguayPeruPhilippinesPolandPortugalPost-demographic dividendPre-demographic dividendPuerto RicoQatarRomaniaRussian FederationRwandaSamoaSan MarinoSao Tome and PrincipeSaudi ArabiaSenegalSerbiaSeychellesSierra LeoneSingaporeSint Maarten (Dutch part)Slovak RepublicSloveniaSmall statesSolomon IslandsSomaliaSouth AfricaSouth AsiaSouth Asia (IDA & IBRD)South SudanSpainSri LankaSt. Kitts and NevisSt. LuciaSt. Vincent and the GrenadinesSub-Saharan Africa Sub-Saharan Africa (excluding high income)Sub-Saharan Africa (IDA & IBRD countries)SudanSurinameSwazilandSwedenSwitzerlandSyrian Arab RepublicTajikistanTanzaniaThailandTimor-LesteTogoTongaTrinidad and TobagoTunisiaTurkeyTurkmenistanTurks and Caicos IslandsTuvaluUgandaUkraineUnited Arab EmiratesUnited KingdomUnited StatesUpper middle incomeUruguayUzbekistanVanuatuVenezuela, RBVietnamWest Bank and GazaWorldYemen, Rep.ZambiaZimbabwe Timeline:
This timeline shows a graph from 1971 to 2015 of Latin America & Caribbean (excluding high income). No data until 1970. Number of actual observations by date: 45.
Source name:
World Development Indicators
Source organization:
UNESCO Institute for Statistics
Categories, topics:
Education, Gender
Last updated:
apr 23, 2017
Indicators value changes by year
Minimum:
47.074
jan 1, 1971
At the date of observation
Value
Absolute change
Change from previous value
jan 1, 1971
47.074
+47.074
0.0%
jan 1, 1972
47.844
+0.77
1.64%
jan 1, 1973
47.885
+0.041
0.09%
jan 1, 1974
47.903
+0.018
0.04%
jan 1, 1975
48.61
+0.707
1.47%
jan 1, 1976
50.993
+2.384
4.9%
jan 1, 1977
50.108
-0.886
-1.74%
jan 1, 1978
49.38
-0.728
-1.45%
jan 1, 1979
49.34
-0.04
-0.08%
jan 1, 1980
49.829
+0.489
0.99%
jan 1, 1981
49.738
-0.091
-0.18%
jan 1, 1982
49.903
+0.165
0.33%
jan 1, 1983
49.934
+0.031
0.06%
jan 1, 1984
49.952
+0.018
0.04%
jan 1, 1985
50.036
+0.085
0.17%
jan 1, 1986
49.559
-0.477
-0.95%
jan 1, 1987
50.232
+0.673
1.36%
jan 1, 1988
50.33
+0.098
0.2%
jan 1, 1989
50.423
+0.094
0.19%
jan 1, 1990
50.5
+0.076
0.15%
jan 1, 1991
50.609
+0.109
0.22%
jan 1, 1992
50.736
+0.128
0.25%
jan 1, 1993
50.829
+0.092
0.18%
jan 1, 1994
50.819
-0.009
-0.02%
jan 1, 1995
50.81
-0.009
-0.02%
jan 1, 1996
50.85
+0.039
0.08%
jan 1, 1997
50.669
-0.181
-0.36%
jan 1, 1998
50.712
+0.043
0.08%
jan 1, 1999
50.692
-0.02
-0.04%
jan 1, 2000
50.726
+0.035
0.07%
jan 1, 2001
50.764
+0.037
0.07%
jan 1, 2002
50.818
+0.055
0.11%
jan 1, 2003
50.866
+0.047
0.09%
jan 1, 2004
50.781
-0.085
-0.17%
jan 1, 2005
51.004
+0.223
0.44%
jan 1, 2006
51.058
+0.054
0.11%
jan 1, 2007
51.1
+0.042
0.08%
jan 1, 2008
51.072
-0.027
-0.05%
jan 1, 2009
51.057
-0.015
-0.03%
jan 1, 2010
50.944
-0.113
-0.22%
jan 1, 2011
50.793
-0.151
-0.3%
jan 1, 2012
50.702
-0.091
-0.18%
jan 1, 2013
50.522
-0.18
-0.35%
jan 1, 2014
50.34
-0.183
-0.36%
jan 1, 2015
50.301
-0.039
-0.08%
Ranking of countries by current statistics by years


Comments: