29
/
en
AIzaSyAYiBZKx7MnpbEhh9jyipgxe19OcubqV5w
April 1, 2024
73331
Australia
AUS
true
2
1
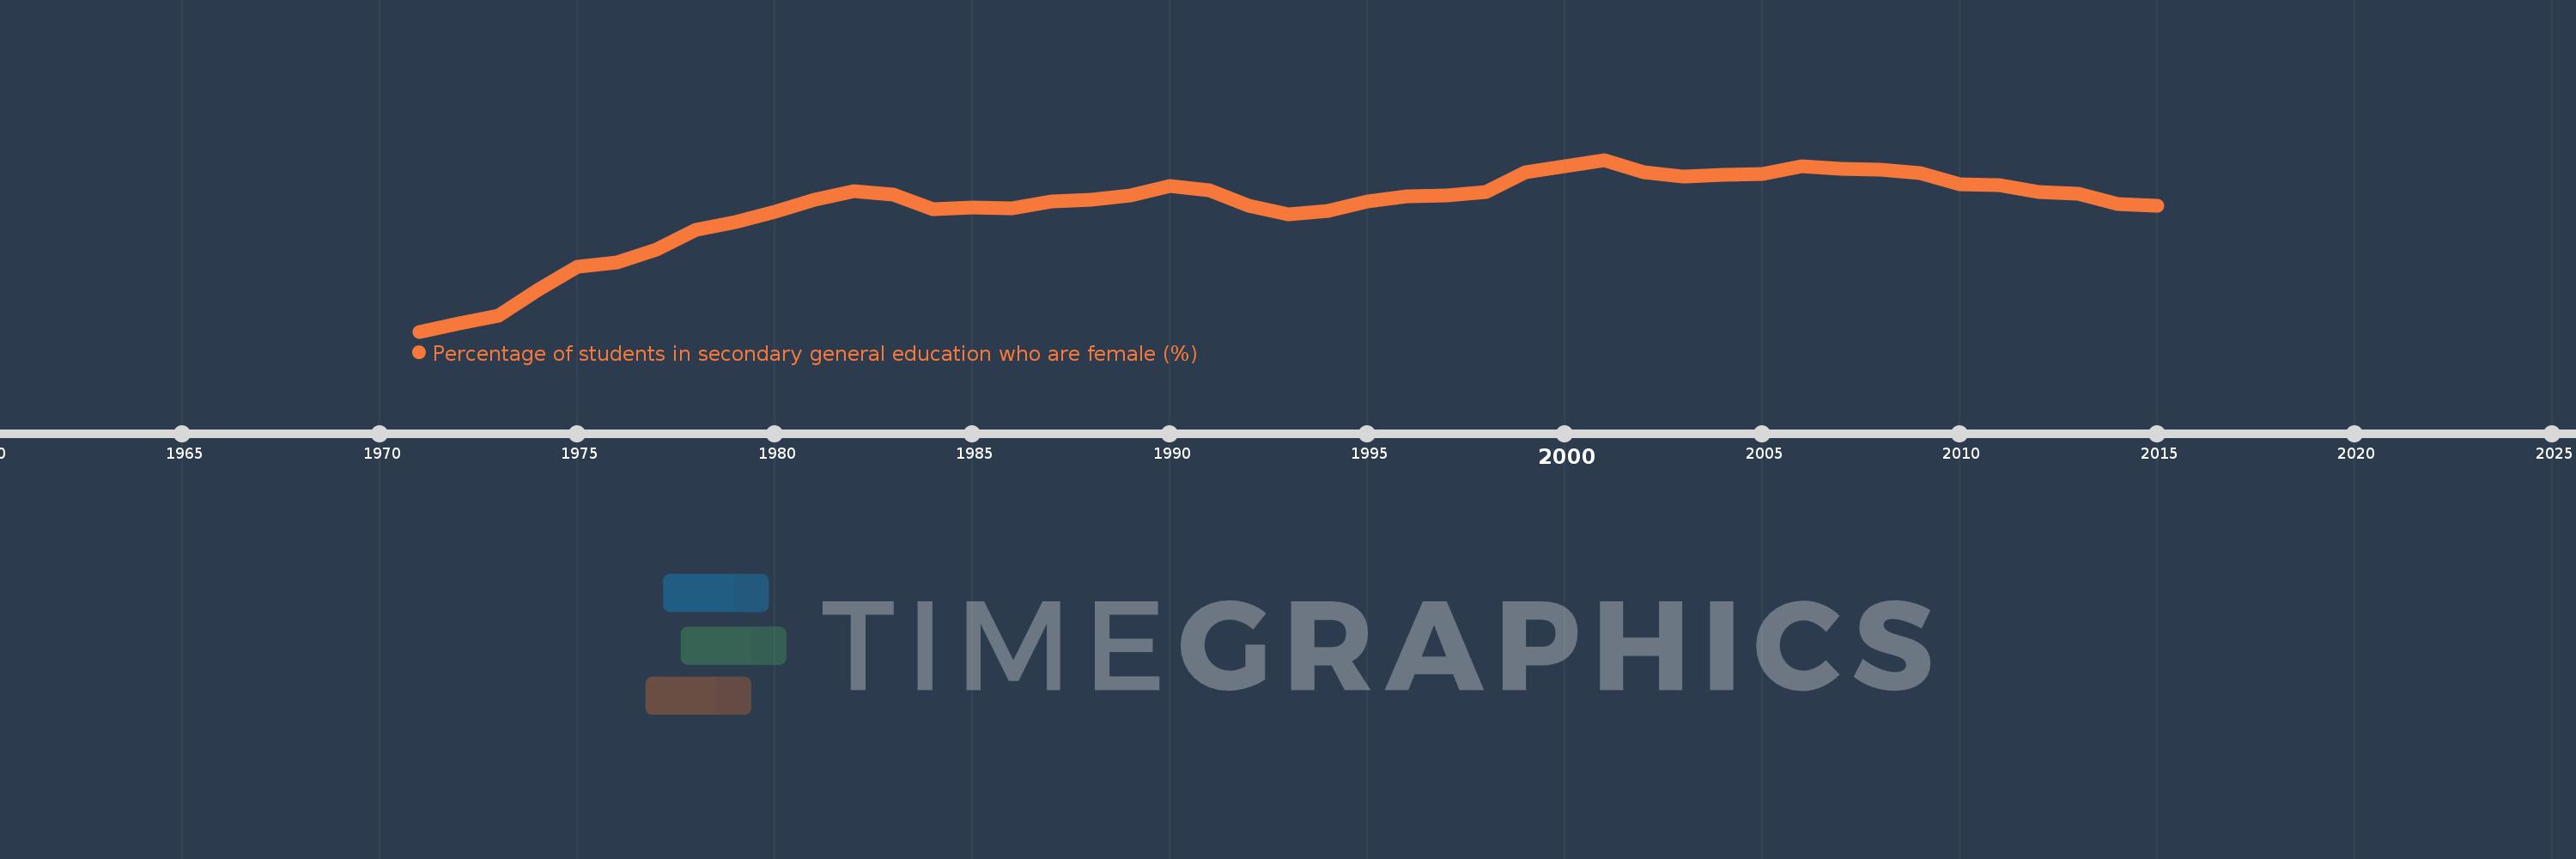
Percentage of students in secondary general education who are female (%)
2015,2014,2013,2012,2011,2010,2009,2008,2007,2006,2005,2004,2003,2002,2001,2000,1999,1998,1997,1996,1995,1994,1993,1992,1991,1990,1989,1988,1987,1986,1985,1984,1983,1982,1981,1980,1979,1978,1977,1976,1975,1974,1973,1972,1971
This statistics in other country:
AfghanistanAlbaniaAlgeriaAndorraAngolaAntigua and BarbudaArab WorldArgentinaArmeniaArubaAustraliaAustriaAzerbaijanBahamas, TheBahrainBangladeshBarbadosBelarusBelgiumBelizeBeninBermudaBhutanBoliviaBosnia and HerzegovinaBotswanaBrazilBritish Virgin IslandsBrunei DarussalamBulgariaBurkina FasoBurundiCabo VerdeCambodiaCameroonCanadaCaribbean small statesCayman IslandsCentral African RepublicCentral Europe and the BalticsChadChileChinaColombiaComorosCongo, Dem. Rep.Congo, Rep.Costa RicaCote d'IvoireCroatiaCubaCuracaoCyprusCzech RepublicDenmarkDjiboutiDominicaDominican RepublicEarly-demographic dividendEast Asia & PacificEast Asia & Pacific (excluding high income)East Asia & Pacific (IDA & IBRD countries)EcuadorEgypt, Arab Rep.El SalvadorEquatorial GuineaEritreaEstoniaEthiopiaEuro areaEurope & Central AsiaEurope & Central Asia (excluding high income)Europe & Central Asia (IDA & IBRD countries)European UnionFijiFinlandFragile and conflict affected situationsFranceGabonGambia, TheGeorgiaGermanyGhanaGibraltarGreeceGrenadaGuatemalaGuineaGuinea-BissauGuyanaHaitiHeavily indebted poor countries (HIPC)High incomeHondurasHong Kong SAR, ChinaHungaryIBRD onlyIcelandIDA & IBRD totalIDA blendIDA onlyIDA totalIndiaIndonesiaIran, Islamic Rep.IraqIrelandIsraelItalyJamaicaJapanJordanKazakhstanKenyaKiribatiKorea, Dem. People’s Rep.Korea, Rep.KuwaitKyrgyz RepublicLao PDRLate-demographic dividendLatin America & Caribbean Latin America & Caribbean (excluding high income)Latin America & the Caribbean (IDA & IBRD countries)LatviaLeast developed countries: UN classificationLebanonLesothoLiberiaLibyaLiechtensteinLithuaniaLow & middle incomeLow incomeLower middle incomeLuxembourgMacao SAR, ChinaMacedonia, FYRMadagascarMalawiMalaysiaMaldivesMaliMaltaMarshall IslandsMauritaniaMauritiusMexicoMicronesia, Fed. Sts.Middle East & North AfricaMiddle East & North Africa (excluding high income)Middle East & North Africa (IDA & IBRD countries)Middle incomeMoldovaMonacoMongoliaMontenegroMoroccoMozambiqueMyanmarNamibiaNauruNepalNetherlandsNew ZealandNicaraguaNigerNigeriaNorth AmericaNorwayOECD membersOmanOther small statesPacific island small statesPakistanPalauPanamaPapua New GuineaParaguayPeruPhilippinesPolandPortugalPost-demographic dividendPre-demographic dividendPuerto RicoQatarRomaniaRussian FederationRwandaSamoaSan MarinoSao Tome and PrincipeSaudi ArabiaSenegalSerbiaSeychellesSierra LeoneSingaporeSint Maarten (Dutch part)Slovak RepublicSloveniaSmall statesSolomon IslandsSomaliaSouth AfricaSouth AsiaSouth Asia (IDA & IBRD)South SudanSpainSri LankaSt. Kitts and NevisSt. LuciaSt. Vincent and the GrenadinesSub-Saharan Africa Sub-Saharan Africa (excluding high income)Sub-Saharan Africa (IDA & IBRD countries)SudanSurinameSwazilandSwedenSwitzerlandSyrian Arab RepublicTajikistanTanzaniaThailandTimor-LesteTogoTongaTrinidad and TobagoTunisiaTurkeyTurkmenistanTurks and Caicos IslandsTuvaluUgandaUkraineUnited Arab EmiratesUnited KingdomUnited StatesUpper middle incomeUruguayUzbekistanVanuatuVenezuela, RBVietnamWest Bank and GazaWorldYemen, Rep.ZambiaZimbabwe Timeline:
This timeline shows a graph from 1971 to 2015 of Australia. No data until 1970. Number of actual observations by date: 45.
Source name:
World Development Indicators
Source organization:
UNESCO Institute for Statistics
Categories, topics:
Education, Gender
Last updated:
apr 23, 2017
Indicators value changes by year
Minimum:
47.771
jan 1, 1971
Maximum:
50.158
jan 1, 2001
At the date of observation
Value
Absolute change
Change from previous value
jan 1, 1971
47.771
+47.771
0.0%
jan 1, 1972
47.886
+0.115
0.24%
jan 1, 1973
47.994
+0.108
0.23%
jan 1, 1974
48.352
+0.358
0.75%
jan 1, 1975
48.669
+0.317
0.66%
jan 1, 1976
48.728
+0.058
0.12%
jan 1, 1977
48.905
+0.178
0.36%
jan 1, 1978
49.187
+0.282
0.58%
jan 1, 1979
49.289
+0.102
0.21%
jan 1, 1980
49.44
+0.151
0.31%
jan 1, 1981
49.606
+0.166
0.34%
jan 1, 1982
49.72
+0.114
0.23%
jan 1, 1983
49.669
-0.051
-0.1%
jan 1, 1984
49.477
-0.192
-0.39%
jan 1, 1985
49.496
+0.019
0.04%
jan 1, 1986
49.487
-0.009
-0.02%
jan 1, 1987
49.584
+0.097
0.2%
jan 1, 1988
49.603
+0.019
0.04%
jan 1, 1989
49.661
+0.057
0.12%
jan 1, 1990
49.794
+0.133
0.27%
jan 1, 1991
49.735
-0.059
-0.12%
jan 1, 1992
49.524
-0.211
-0.42%
jan 1, 1993
49.395
-0.129
-0.26%
jan 1, 1994
49.447
+0.051
0.1%
jan 1, 1995
49.579
+0.132
0.27%
jan 1, 1996
49.654
+0.076
0.15%
jan 1, 1997
49.666
+0.011
0.02%
jan 1, 1998
49.716
+0.051
0.1%
jan 1, 1999
49.987
+0.271
0.54%
jan 1, 2000
50.072
+0.085
0.17%
jan 1, 2001
50.158
+0.087
0.17%
jan 1, 2002
49.984
-0.175
-0.35%
jan 1, 2003
49.928
-0.055
-0.11%
jan 1, 2004
49.948
+0.02
0.04%
jan 1, 2005
49.965
+0.016
0.03%
jan 1, 2006
50.072
+0.107
0.21%
jan 1, 2007
50.031
-0.041
-0.08%
jan 1, 2008
50.018
-0.014
-0.03%
jan 1, 2009
49.969
-0.049
-0.1%
jan 1, 2010
49.816
-0.153
-0.31%
jan 1, 2011
49.811
-0.005
-0.01%
jan 1, 2012
49.708
-0.103
-0.21%
jan 1, 2013
49.681
-0.027
-0.05%
jan 1, 2014
49.549
-0.132
-0.27%
jan 1, 2015
49.523
-0.026
-0.05%
Ranking of countries by current statistics by years


Comments: