29
/
en
AIzaSyAYiBZKx7MnpbEhh9jyipgxe19OcubqV5w
April 1, 2024
233180
San Marino
SMR
true
2
1
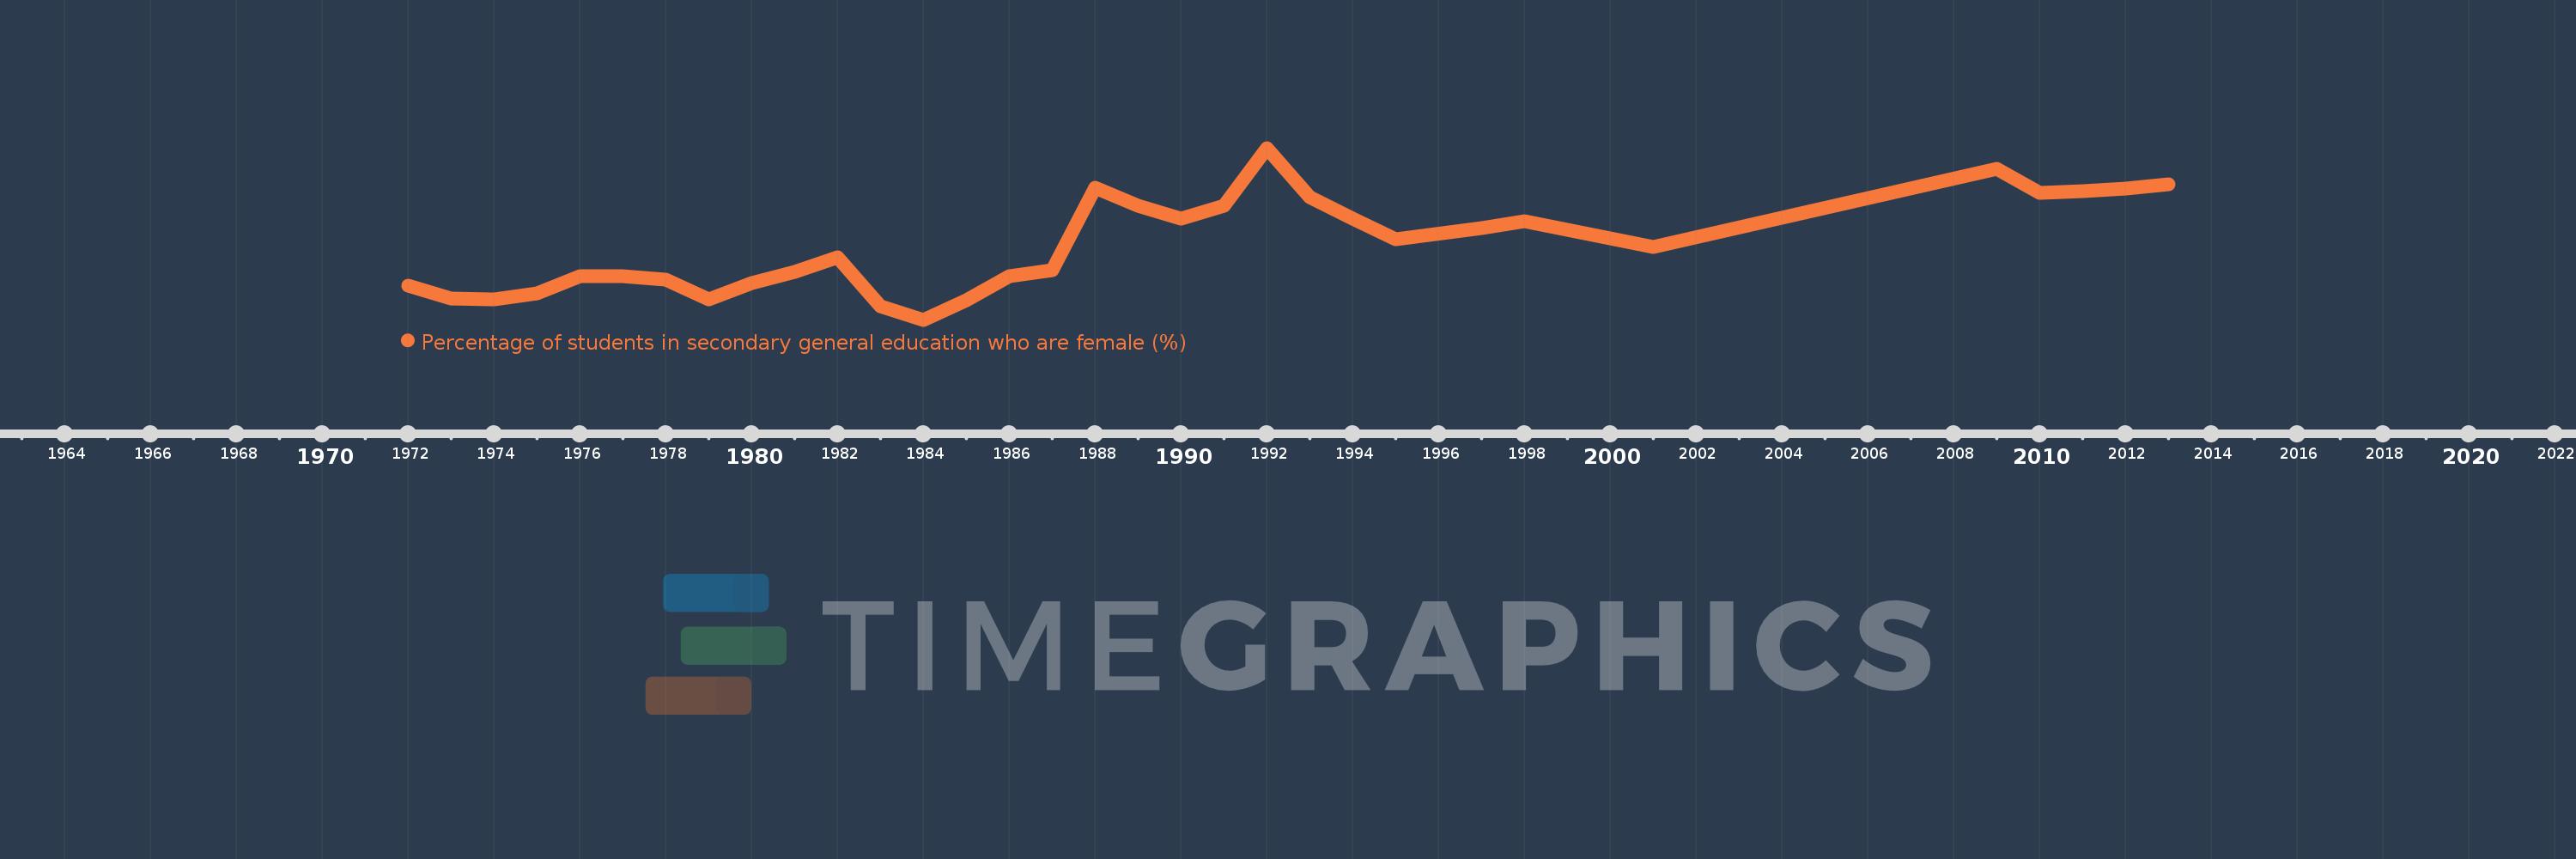
Percentage of students in secondary general education who are female (%)
2013,2012,2011,2010,2009,2001,1998,1997,1995,1994,1993,1992,1991,1990,1989,1988,1987,1986,1985,1984,1983,1982,1981,1980,1979,1978,1977,1976,1975,1974,1973,1972
This statistics in other country:
AfghanistanAlbaniaAlgeriaAndorraAngolaAntigua and BarbudaArab WorldArgentinaArmeniaArubaAustraliaAustriaAzerbaijanBahamas, TheBahrainBangladeshBarbadosBelarusBelgiumBelizeBeninBermudaBhutanBoliviaBosnia and HerzegovinaBotswanaBrazilBritish Virgin IslandsBrunei DarussalamBulgariaBurkina FasoBurundiCabo VerdeCambodiaCameroonCanadaCaribbean small statesCayman IslandsCentral African RepublicCentral Europe and the BalticsChadChileChinaColombiaComorosCongo, Dem. Rep.Congo, Rep.Costa RicaCote d'IvoireCroatiaCubaCuracaoCyprusCzech RepublicDenmarkDjiboutiDominicaDominican RepublicEarly-demographic dividendEast Asia & PacificEast Asia & Pacific (excluding high income)East Asia & Pacific (IDA & IBRD countries)EcuadorEgypt, Arab Rep.El SalvadorEquatorial GuineaEritreaEstoniaEthiopiaEuro areaEurope & Central AsiaEurope & Central Asia (excluding high income)Europe & Central Asia (IDA & IBRD countries)European UnionFijiFinlandFragile and conflict affected situationsFranceGabonGambia, TheGeorgiaGermanyGhanaGibraltarGreeceGrenadaGuatemalaGuineaGuinea-BissauGuyanaHaitiHeavily indebted poor countries (HIPC)High incomeHondurasHong Kong SAR, ChinaHungaryIBRD onlyIcelandIDA & IBRD totalIDA blendIDA onlyIDA totalIndiaIndonesiaIran, Islamic Rep.IraqIrelandIsraelItalyJamaicaJapanJordanKazakhstanKenyaKiribatiKorea, Dem. People’s Rep.Korea, Rep.KuwaitKyrgyz RepublicLao PDRLate-demographic dividendLatin America & Caribbean Latin America & Caribbean (excluding high income)Latin America & the Caribbean (IDA & IBRD countries)LatviaLeast developed countries: UN classificationLebanonLesothoLiberiaLibyaLiechtensteinLithuaniaLow & middle incomeLow incomeLower middle incomeLuxembourgMacao SAR, ChinaMacedonia, FYRMadagascarMalawiMalaysiaMaldivesMaliMaltaMarshall IslandsMauritaniaMauritiusMexicoMicronesia, Fed. Sts.Middle East & North AfricaMiddle East & North Africa (excluding high income)Middle East & North Africa (IDA & IBRD countries)Middle incomeMoldovaMonacoMongoliaMontenegroMoroccoMozambiqueMyanmarNamibiaNauruNepalNetherlandsNew ZealandNicaraguaNigerNigeriaNorth AmericaNorwayOECD membersOmanOther small statesPacific island small statesPakistanPalauPanamaPapua New GuineaParaguayPeruPhilippinesPolandPortugalPost-demographic dividendPre-demographic dividendPuerto RicoQatarRomaniaRussian FederationRwandaSamoaSan MarinoSao Tome and PrincipeSaudi ArabiaSenegalSerbiaSeychellesSierra LeoneSingaporeSint Maarten (Dutch part)Slovak RepublicSloveniaSmall statesSolomon IslandsSomaliaSouth AfricaSouth AsiaSouth Asia (IDA & IBRD)South SudanSpainSri LankaSt. Kitts and NevisSt. LuciaSt. Vincent and the GrenadinesSub-Saharan Africa Sub-Saharan Africa (excluding high income)Sub-Saharan Africa (IDA & IBRD countries)SudanSurinameSwazilandSwedenSwitzerlandSyrian Arab RepublicTajikistanTanzaniaThailandTimor-LesteTogoTongaTrinidad and TobagoTunisiaTurkeyTurkmenistanTurks and Caicos IslandsTuvaluUgandaUkraineUnited Arab EmiratesUnited KingdomUnited StatesUpper middle incomeUruguayUzbekistanVanuatuVenezuela, RBVietnamWest Bank and GazaWorldYemen, Rep.ZambiaZimbabwe Timeline:
This timeline shows a graph from 1972 to 2013 of San Marino. No data until 1971. Number of actual observations by date: 32.
Source name:
World Development Indicators
Source organization:
UNESCO Institute for Statistics
Categories, topics:
Education, Gender
Last updated:
apr 23, 2017
Indicators value changes by year
Minimum:
44.723
jan 1, 1984
Maximum:
55.502
jan 1, 1992
At the date of observation
Value
Absolute change
Change from previous value
jan 1, 1972
46.837
+46.837
0.0%
jan 1, 1973
46.053
-0.784
-1.67%
jan 1, 1974
45.998
-0.054
-0.12%
jan 1, 1975
46.368
+0.37
0.8%
jan 1, 1976
47.456
+1.088
2.35%
jan 1, 1977
47.481
+0.025
0.05%
jan 1, 1978
47.256
-0.225
-0.47%
jan 1, 1979
45.988
-1.268
-2.68%
jan 1, 1980
47.034
+1.046
2.27%
jan 1, 1981
47.72
+0.686
1.46%
jan 1, 1982
48.646
+0.927
1.94%
jan 1, 1983
45.569
-3.078
-6.33%
jan 1, 1984
44.723
-0.846
-1.86%
jan 1, 1985
45.972
+1.249
2.79%
jan 1, 1986
47.46
+1.489
3.24%
jan 1, 1987
47.837
+0.376
0.79%
jan 1, 1988
53.011
+5.174
10.82%
jan 1, 1989
51.876
-1.135
-2.14%
jan 1, 1990
51.058
-0.818
-1.58%
jan 1, 1991
51.879
+0.821
1.61%
jan 1, 1992
55.502
+3.623
6.98%
jan 1, 1993
52.4
-3.103
-5.59%
jan 1, 1994
51.049
-1.351
-2.58%
jan 1, 1995
49.799
-1.25
-2.45%
jan 1, 1997
50.473
+0.674
1.35%
jan 1, 1998
50.894
+0.421
0.83%
jan 1, 2001
49.292
-1.602
-3.15%
jan 1, 2009
54.211
+4.919
9.98%
jan 1, 2010
52.691
-1.519
-2.8%
jan 1, 2011
52.779
+0.088
0.17%
jan 1, 2012
52.929
+0.149
0.28%
jan 1, 2013
53.237
+0.308
0.58%
Ranking of countries by current statistics by years


Comments: