29
/
en
AIzaSyAYiBZKx7MnpbEhh9jyipgxe19OcubqV5w
April 1, 2024
89573
Botswana
BWA
true
2
1
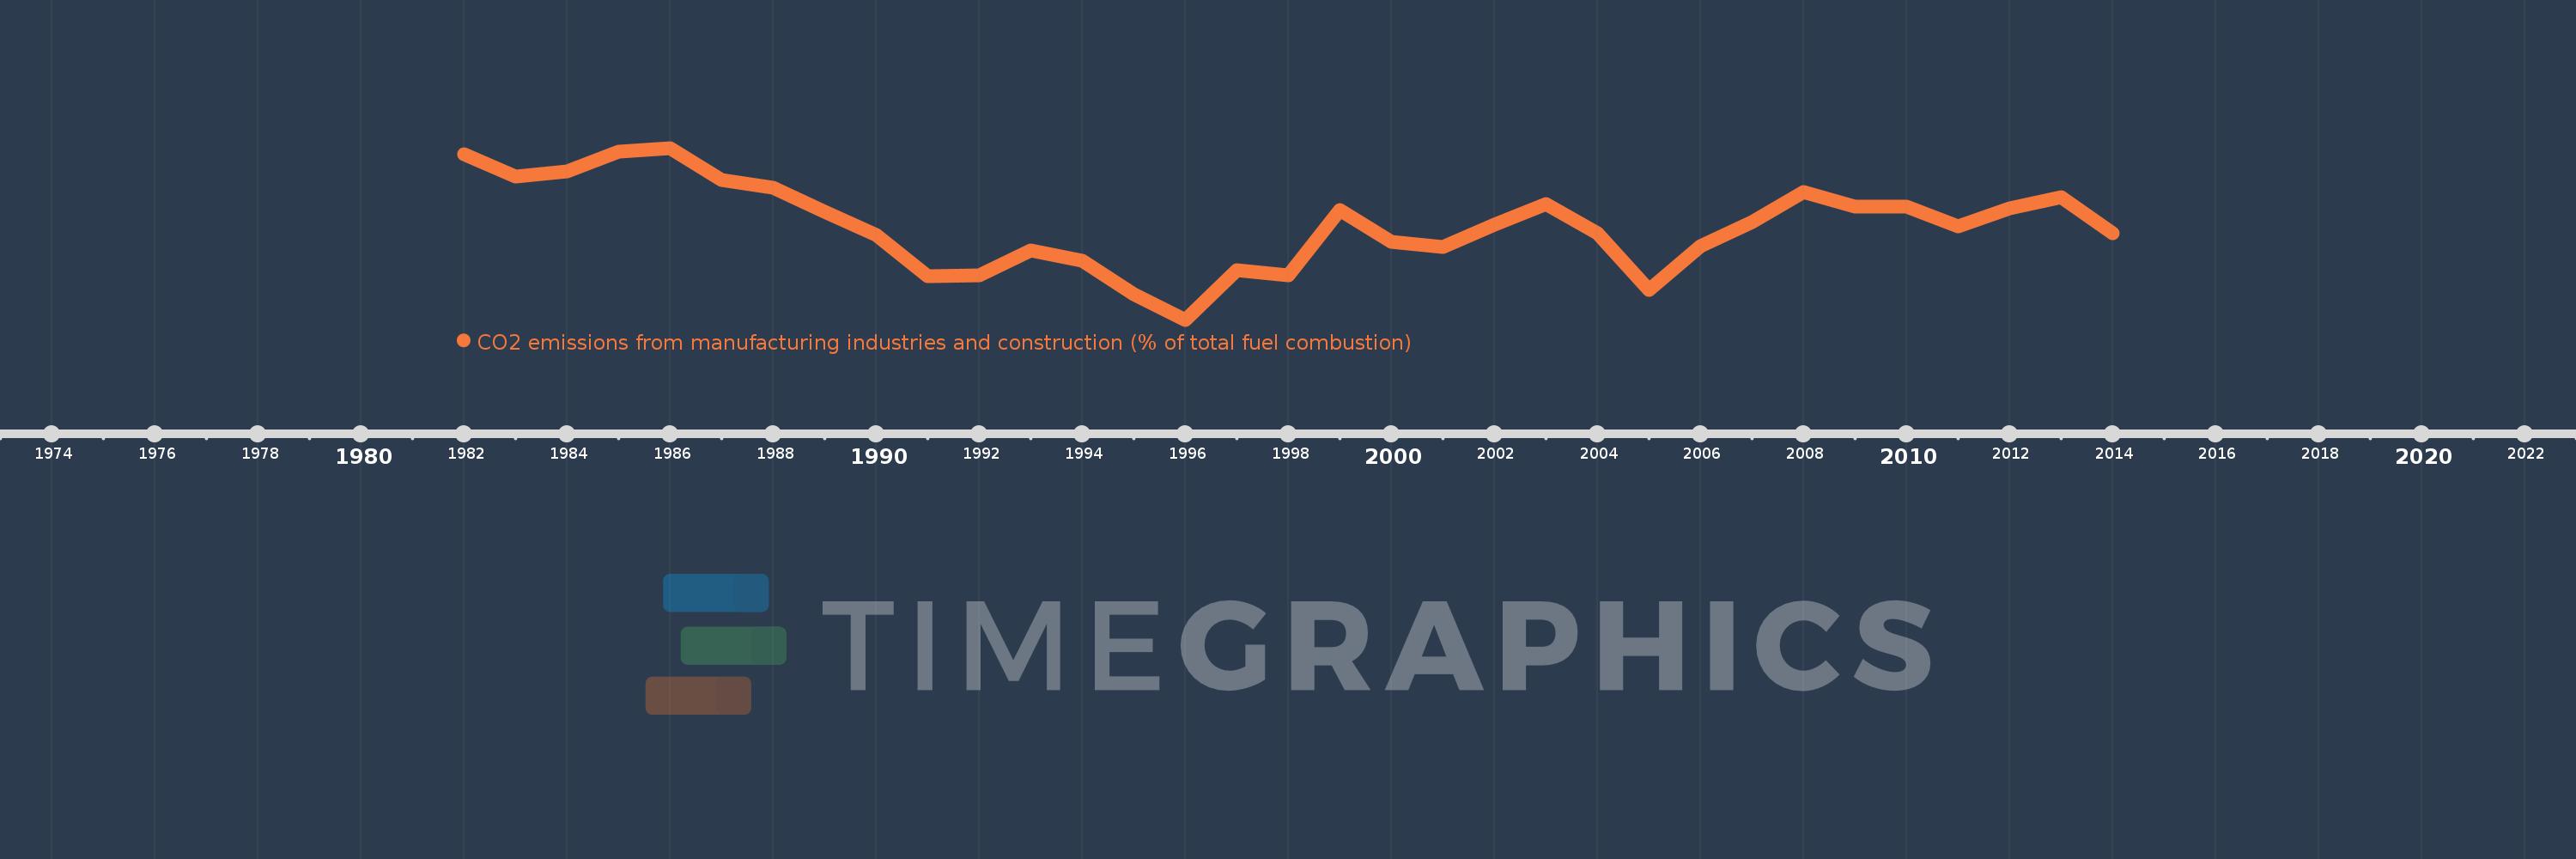
CO2 emissions from manufacturing industries and construction (% of total fuel combustion)
2014,2013,2012,2011,2010,2009,2008,2007,2006,2005,2004,2003,2002,2001,2000,1999,1998,1997,1996,1995,1994,1993,1992,1991,1990,1989,1988,1987,1986,1985,1984,1983,1982
This statistics in other country:
AlbaniaAlgeriaAngolaArab WorldArgentinaArmeniaAustraliaAustriaAzerbaijanBahrainBangladeshBelarusBelgiumBeninBoliviaBosnia and HerzegovinaBotswanaBrazilBrunei DarussalamBulgariaCambodiaCameroonCanadaCaribbean small statesCentral Europe and the BalticsChileChinaColombiaCongo, Dem. Rep.Congo, Rep.Costa RicaCote d'IvoireCroatiaCubaCuracaoCyprusCzech RepublicDenmarkDominican RepublicEarly-demographic dividendEast Asia & PacificEast Asia & Pacific (excluding high income)East Asia & Pacific (IDA & IBRD countries)EcuadorEgypt, Arab Rep.El SalvadorEritreaEstoniaEthiopiaEuro areaEurope & Central AsiaEurope & Central Asia (excluding high income)Europe & Central Asia (IDA & IBRD countries)European UnionFinlandFragile and conflict affected situationsFranceGabonGeorgiaGermanyGhanaGibraltarGreeceGuatemalaHaitiHeavily indebted poor countries (HIPC)High incomeHondurasHong Kong SAR, ChinaHungaryIBRD onlyIcelandIDA & IBRD totalIDA blendIDA onlyIDA totalIndiaIndonesiaIran, Islamic Rep.IraqIrelandIsraelItalyJamaicaJapanJordanKazakhstanKenyaKorea, Dem. People’s Rep.Korea, Rep.KosovoKuwaitKyrgyz RepublicLate-demographic dividendLatin America & Caribbean Latin America & Caribbean (excluding high income)Latin America & the Caribbean (IDA & IBRD countries)LatviaLeast developed countries: UN classificationLebanonLibyaLithuaniaLow & middle incomeLow incomeLower middle incomeLuxembourgMacedonia, FYRMalaysiaMaltaMauritiusMexicoMiddle East & North AfricaMiddle East & North Africa (excluding high income)Middle East & North Africa (IDA & IBRD countries)Middle incomeMoldovaMongoliaMontenegroMoroccoMozambiqueMyanmarNamibiaNepalNetherlandsNew ZealandNicaraguaNigerNigeriaNorth AmericaNorwayOECD membersOmanOther small statesPakistanPanamaParaguayPeruPhilippinesPolandPortugalPost-demographic dividendPre-demographic dividendQatarRomaniaRussian FederationSaudi ArabiaSenegalSerbiaSingaporeSlovak RepublicSloveniaSmall statesSouth AfricaSouth AsiaSouth Asia (IDA & IBRD)South SudanSpainSri LankaSub-Saharan Africa Sub-Saharan Africa (excluding high income)Sub-Saharan Africa (IDA & IBRD countries)SudanSwedenSwitzerlandSyrian Arab RepublicTajikistanTanzaniaThailandTogoTrinidad and TobagoTunisiaTurkeyTurkmenistanUkraineUnited Arab EmiratesUnited KingdomUnited StatesUpper middle incomeUruguayUzbekistanVenezuela, RBVietnamWorldYemen, Rep.ZambiaZimbabwe Timeline:
This timeline shows a graph from 1982 to 2014 of Botswana. No data until 1981. Number of actual observations by date: 33.
Source name:
World Development Indicators
Source organization:
IEA Statistics © OECD/IEA 2014 (http://www.iea.org/stats/index.asp), subject to https://www.iea.org/t&c/termsandconditions/
Categories, topics:
Environment
Last updated:
apr 23, 2017
Indicators value changes by year
Minimum:
12.539
jan 1, 1996
Maximum:
33.333
jan 1, 1986
At the date of observation
Value
Absolute change
Change from previous value
jan 1, 1982
32.609
+32.609
0.0%
jan 1, 1983
29.861
-2.748
-8.43%
jan 1, 1984
30.496
+0.635
2.13%
jan 1, 1985
32.857
+2.361
7.74%
jan 1, 1986
33.333
+0.476
1.45%
jan 1, 1987
29.48
-3.854
-11.56%
jan 1, 1988
28.492
-0.988
-3.35%
jan 1, 1989
25.581
-2.91
-10.21%
jan 1, 1990
22.785
-2.797
-10.93%
jan 1, 1991
17.794
-4.991
-21.91%
jan 1, 1992
17.949
+0.155
0.87%
jan 1, 1993
20.909
+2.96
16.49%
jan 1, 1994
19.692
-1.217
-5.82%
jan 1, 1995
15.584
-4.108
-20.86%
jan 1, 1996
12.539
-3.045
-19.54%
jan 1, 1997
18.493
+5.954
47.48%
jan 1, 1998
17.915
-0.578
-3.12%
jan 1, 1999
25.815
+7.9
44.1%
jan 1, 2000
22.021
-3.794
-14.7%
jan 1, 2001
21.34
-0.681
-3.09%
jan 1, 2002
24.031
+2.691
12.61%
jan 1, 2003
26.551
+2.52
10.49%
jan 1, 2004
23.018
-3.533
-13.31%
jan 1, 2005
16.121
-6.897
-29.96%
jan 1, 2006
21.495
+5.374
33.34%
jan 1, 2007
24.324
+2.829
13.16%
jan 1, 2008
28.009
+3.685
15.15%
jan 1, 2009
26.196
-1.813
-6.47%
jan 1, 2010
26.225
+0.03
0.11%
jan 1, 2011
23.819
-2.406
-9.17%
jan 1, 2012
26.039
+2.22
9.32%
jan 1, 2013
27.354
+1.315
5.05%
jan 1, 2014
22.993
-4.362
-15.94%
Ranking of countries by current statistics by years


Comments: