29
/
en
AIzaSyAYiBZKx7MnpbEhh9jyipgxe19OcubqV5w
April 1, 2024
72783
Australia
AUS
true
2
1
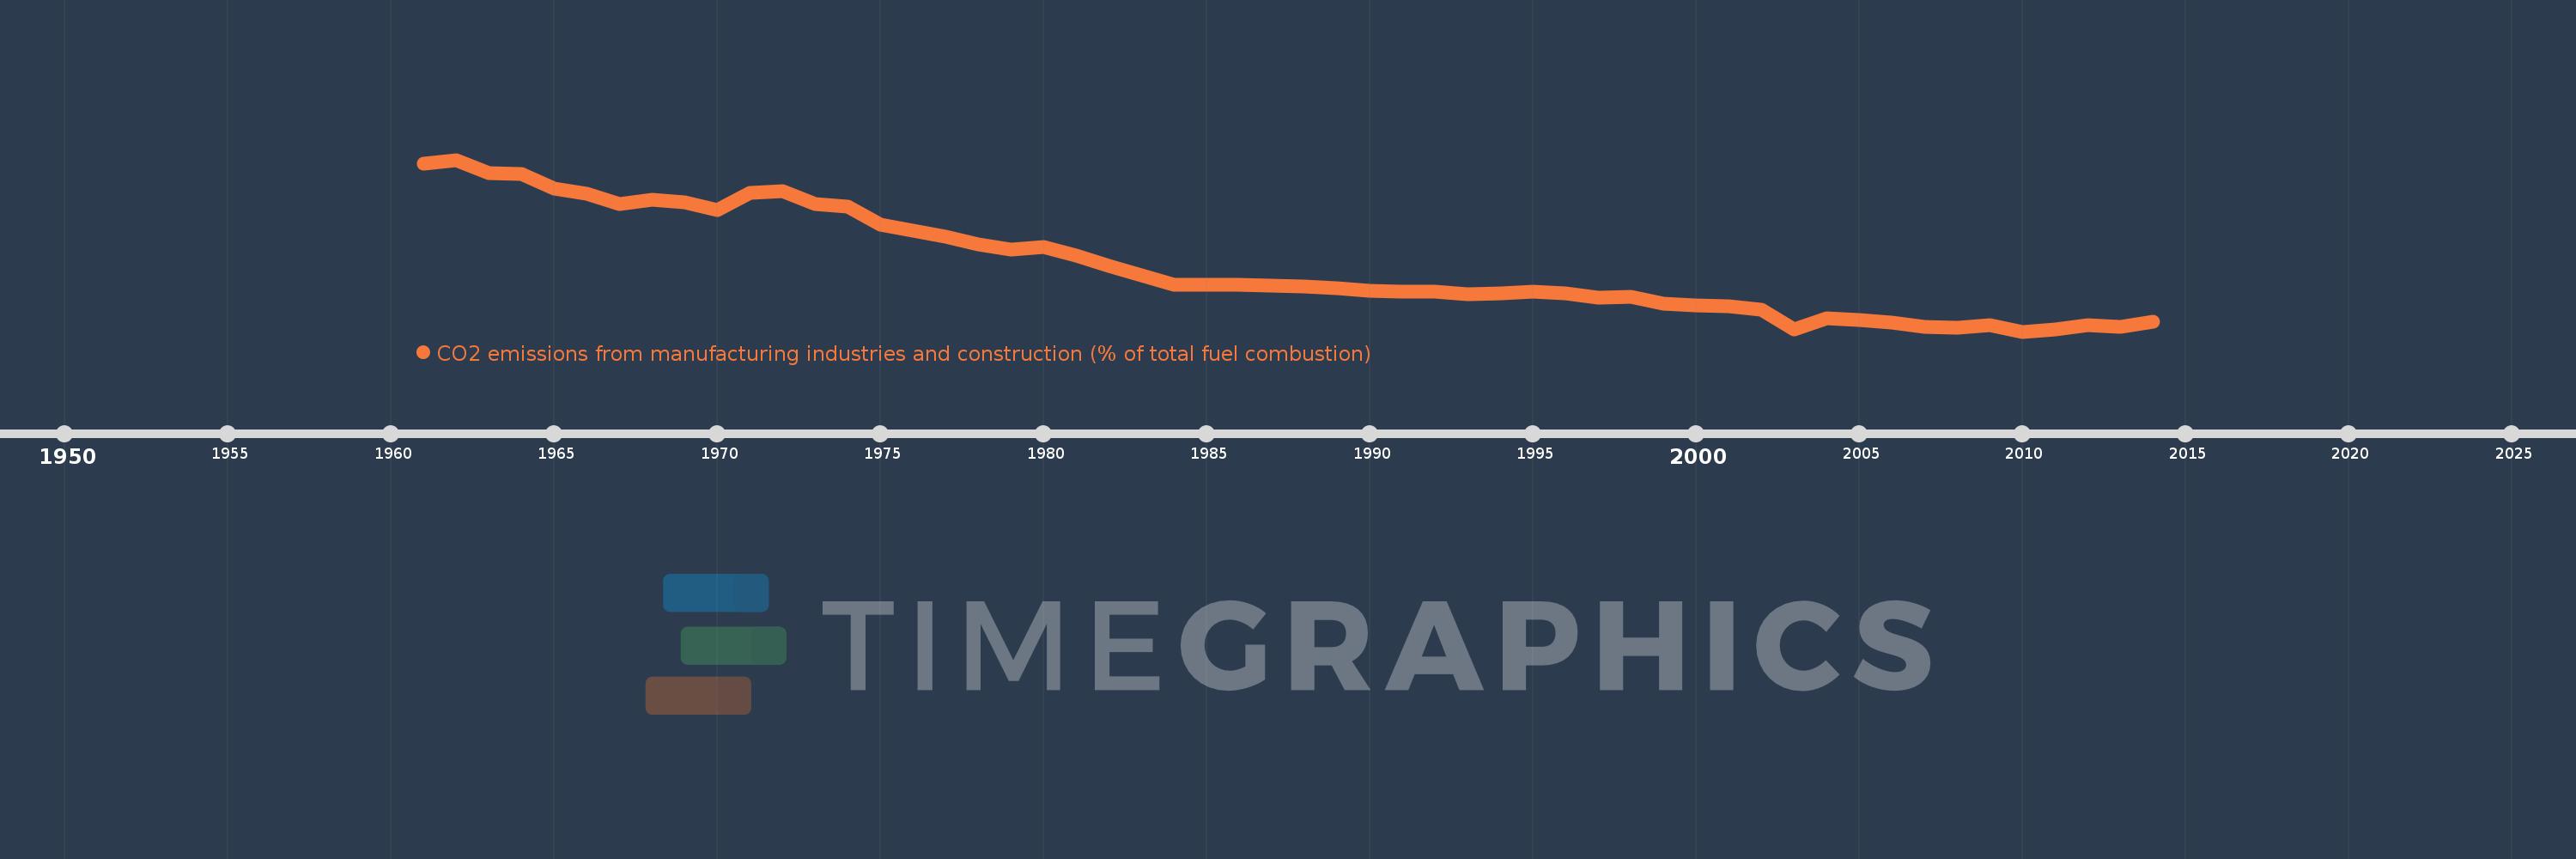
CO2 emissions from manufacturing industries and construction (% of total fuel combustion)
2014,2013,2012,2011,2010,2009,2008,2007,2006,2005,2004,2003,2002,2001,2000,1999,1998,1997,1996,1995,1994,1993,1992,1991,1990,1989,1988,1987,1986,1985,1984,1983,1982,1981,1980,1979,1978,1977,1976,1975,1974,1973,1972,1971,1970,1969,1968,1967,1966,1965,1964,1963,1962,1961
This statistics in other country:
AlbaniaAlgeriaAngolaArab WorldArgentinaArmeniaAustraliaAustriaAzerbaijanBahrainBangladeshBelarusBelgiumBeninBoliviaBosnia and HerzegovinaBotswanaBrazilBrunei DarussalamBulgariaCambodiaCameroonCanadaCaribbean small statesCentral Europe and the BalticsChileChinaColombiaCongo, Dem. Rep.Congo, Rep.Costa RicaCote d'IvoireCroatiaCubaCuracaoCyprusCzech RepublicDenmarkDominican RepublicEarly-demographic dividendEast Asia & PacificEast Asia & Pacific (excluding high income)East Asia & Pacific (IDA & IBRD countries)EcuadorEgypt, Arab Rep.El SalvadorEritreaEstoniaEthiopiaEuro areaEurope & Central AsiaEurope & Central Asia (excluding high income)Europe & Central Asia (IDA & IBRD countries)European UnionFinlandFragile and conflict affected situationsFranceGabonGeorgiaGermanyGhanaGibraltarGreeceGuatemalaHaitiHeavily indebted poor countries (HIPC)High incomeHondurasHong Kong SAR, ChinaHungaryIBRD onlyIcelandIDA & IBRD totalIDA blendIDA onlyIDA totalIndiaIndonesiaIran, Islamic Rep.IraqIrelandIsraelItalyJamaicaJapanJordanKazakhstanKenyaKorea, Dem. People’s Rep.Korea, Rep.KosovoKuwaitKyrgyz RepublicLate-demographic dividendLatin America & Caribbean Latin America & Caribbean (excluding high income)Latin America & the Caribbean (IDA & IBRD countries)LatviaLeast developed countries: UN classificationLebanonLibyaLithuaniaLow & middle incomeLow incomeLower middle incomeLuxembourgMacedonia, FYRMalaysiaMaltaMauritiusMexicoMiddle East & North AfricaMiddle East & North Africa (excluding high income)Middle East & North Africa (IDA & IBRD countries)Middle incomeMoldovaMongoliaMontenegroMoroccoMozambiqueMyanmarNamibiaNepalNetherlandsNew ZealandNicaraguaNigerNigeriaNorth AmericaNorwayOECD membersOmanOther small statesPakistanPanamaParaguayPeruPhilippinesPolandPortugalPost-demographic dividendPre-demographic dividendQatarRomaniaRussian FederationSaudi ArabiaSenegalSerbiaSingaporeSlovak RepublicSloveniaSmall statesSouth AfricaSouth AsiaSouth Asia (IDA & IBRD)South SudanSpainSri LankaSub-Saharan Africa Sub-Saharan Africa (excluding high income)Sub-Saharan Africa (IDA & IBRD countries)SudanSwedenSwitzerlandSyrian Arab RepublicTajikistanTanzaniaThailandTogoTrinidad and TobagoTunisiaTurkeyTurkmenistanUkraineUnited Arab EmiratesUnited KingdomUnited StatesUpper middle incomeUruguayUzbekistanVenezuela, RBVietnamWorldYemen, Rep.ZambiaZimbabwe Timeline:
This timeline shows a graph from 1961 to 2014 of Australia. No data until 1960. Number of actual observations by date: 54.
Source name:
World Development Indicators
Source organization:
IEA Statistics © OECD/IEA 2014 (http://www.iea.org/stats/index.asp), subject to https://www.iea.org/t&c/termsandconditions/
Categories, topics:
Environment
Last updated:
apr 23, 2017
Indicators value changes by year
Minimum:
10.584
jan 1, 2010
Maximum:
35.916
jan 1, 1962
At the date of observation
Value
Absolute change
Change from previous value
jan 1, 1961
35.376
+35.376
0.0%
jan 1, 1962
35.916
+0.54
1.53%
jan 1, 1963
33.891
-2.025
-5.64%
jan 1, 1964
33.804
-0.088
-0.26%
jan 1, 1965
31.685
-2.118
-6.27%
jan 1, 1966
30.94
-0.746
-2.35%
jan 1, 1967
29.437
-1.502
-4.86%
jan 1, 1968
30.038
+0.601
2.04%
jan 1, 1969
29.59
-0.448
-1.49%
jan 1, 1970
28.498
-1.092
-3.69%
jan 1, 1971
31.06
+2.562
8.99%
jan 1, 1972
31.313
+0.253
0.81%
jan 1, 1973
29.419
-1.894
-6.05%
jan 1, 1974
28.988
-0.43
-1.46%
jan 1, 1975
26.413
-2.575
-8.88%
jan 1, 1976
25.444
-0.968
-3.67%
jan 1, 1977
24.533
-0.912
-3.58%
jan 1, 1978
23.429
-1.104
-4.5%
jan 1, 1979
22.712
-0.717
-3.06%
jan 1, 1980
23.027
+0.315
1.39%
jan 1, 1981
21.834
-1.192
-5.18%
jan 1, 1982
20.22
-1.614
-7.39%
jan 1, 1983
18.915
-1.305
-6.45%
jan 1, 1984
17.499
-1.416
-7.49%
jan 1, 1985
17.519
+0.02
0.11%
jan 1, 1986
17.506
-0.013
-0.07%
jan 1, 1987
17.402
-0.104
-0.59%
jan 1, 1988
17.171
-0.231
-1.33%
jan 1, 1989
17.041
-0.13
-0.76%
jan 1, 1990
16.621
-0.42
-2.46%
jan 1, 1991
16.502
-0.12
-0.72%
jan 1, 1992
16.503
+0.001
0.01%
jan 1, 1993
16.146
-0.357
-2.16%
jan 1, 1994
16.246
+0.1
0.62%
jan 1, 1995
16.509
+0.263
1.62%
jan 1, 1996
16.188
-0.321
-1.95%
jan 1, 1997
15.57
-0.618
-3.82%
jan 1, 1998
15.653
+0.083
0.54%
jan 1, 1999
14.739
-0.915
-5.84%
jan 1, 2000
14.426
-0.313
-2.12%
jan 1, 2001
14.329
-0.096
-0.67%
jan 1, 2002
13.852
-0.477
-3.33%
jan 1, 2003
10.863
-2.989
-21.58%
jan 1, 2004
12.517
+1.654
15.22%
jan 1, 2005
12.319
-0.198
-1.58%
jan 1, 2006
11.928
-0.391
-3.18%
jan 1, 2007
11.331
-0.597
-5.0%
jan 1, 2008
11.203
-0.128
-1.13%
jan 1, 2009
11.517
+0.314
2.81%
jan 1, 2010
10.584
-0.933
-8.1%
jan 1, 2011
10.908
+0.324
3.06%
jan 1, 2012
11.51
+0.602
5.52%
jan 1, 2013
11.308
-0.202
-1.75%
jan 1, 2014
11.994
+0.686
6.07%
Ranking of countries by current statistics by years


Comments: