29
/
en
AIzaSyAYiBZKx7MnpbEhh9jyipgxe19OcubqV5w
April 1, 2024
151398
Hong Kong SAR, China
HKG
true
2
1
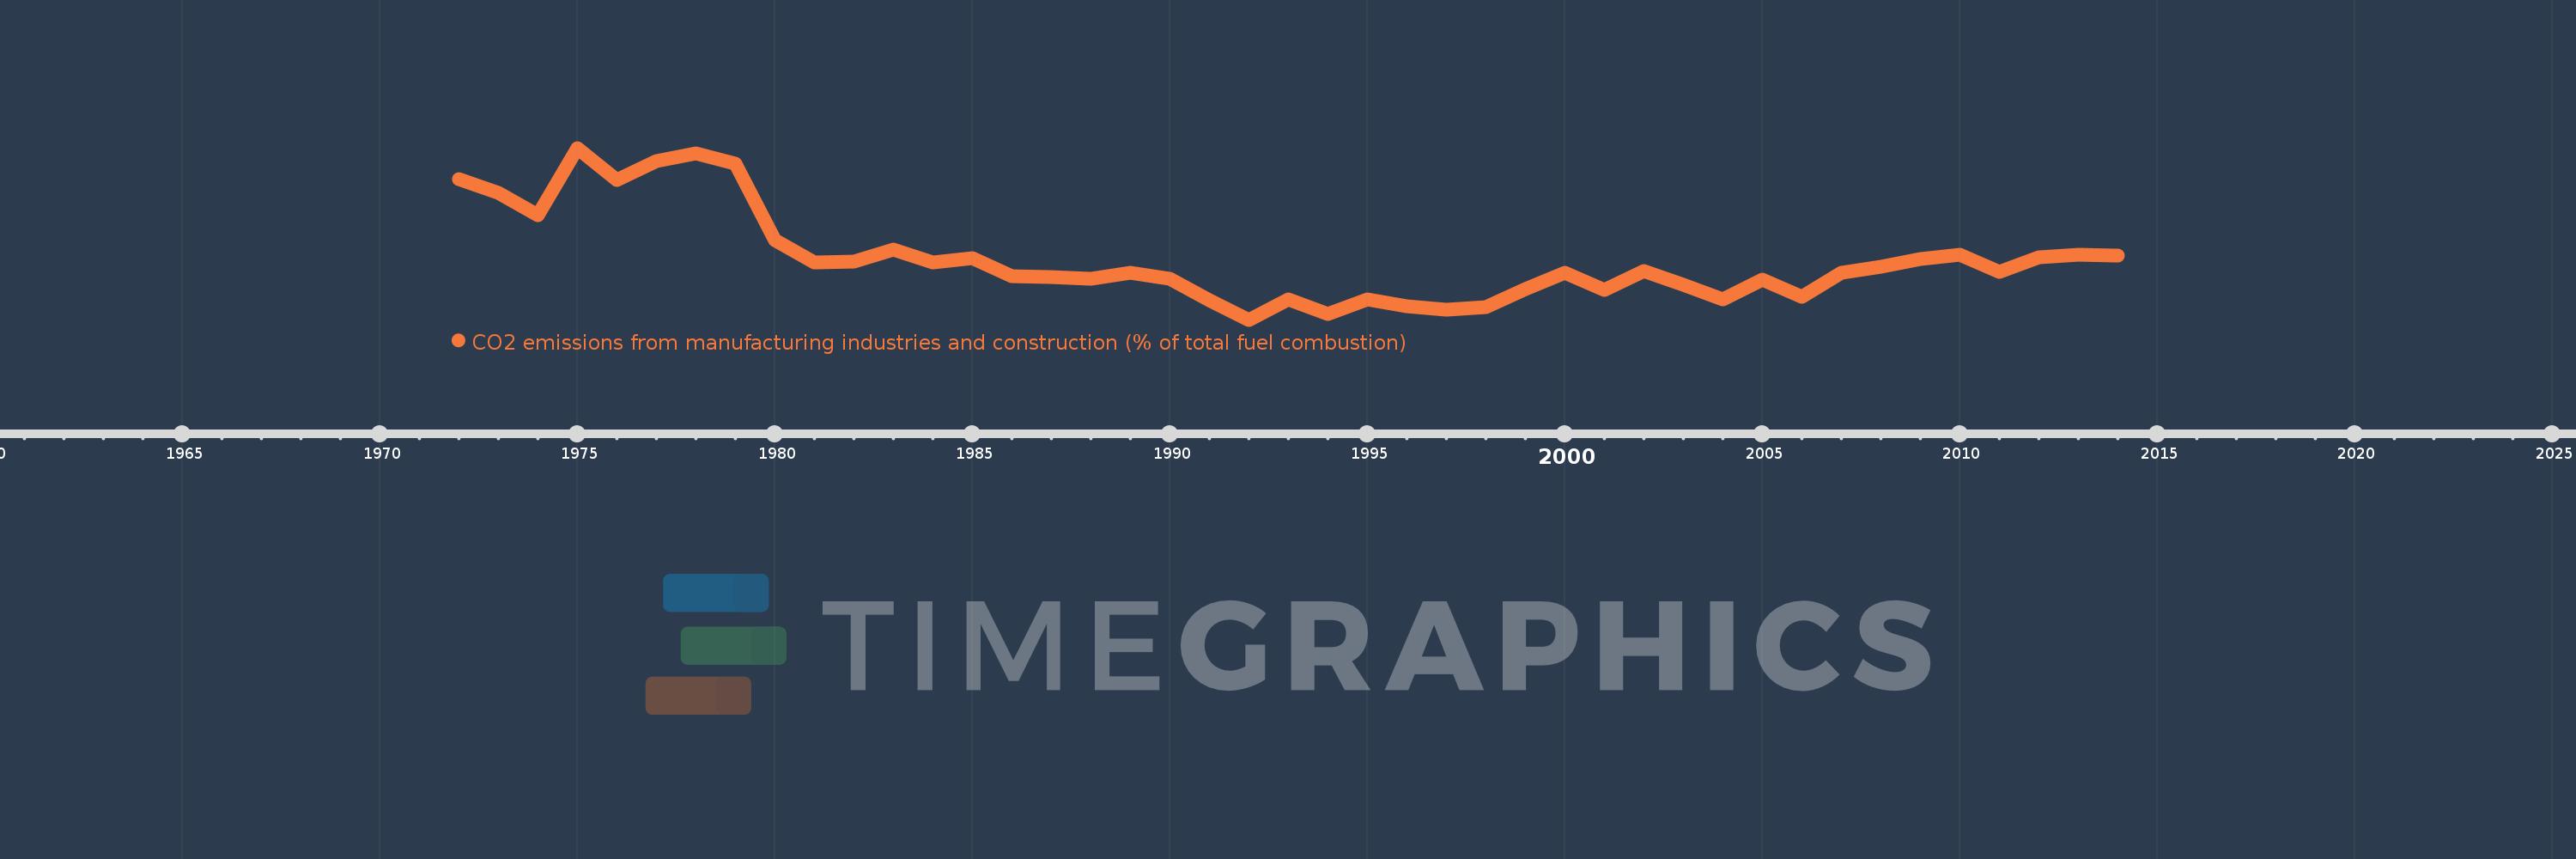
CO2 emissions from manufacturing industries and construction (% of total fuel combustion)
2014,2013,2012,2011,2010,2009,2008,2007,2006,2005,2004,2003,2002,2001,2000,1999,1998,1997,1996,1995,1994,1993,1992,1991,1990,1989,1988,1987,1986,1985,1984,1983,1982,1981,1980,1979,1978,1977,1976,1975,1974,1973,1972
This statistics in other country:
AlbaniaAlgeriaAngolaArab WorldArgentinaArmeniaAustraliaAustriaAzerbaijanBahrainBangladeshBelarusBelgiumBeninBoliviaBosnia and HerzegovinaBotswanaBrazilBrunei DarussalamBulgariaCambodiaCameroonCanadaCaribbean small statesCentral Europe and the BalticsChileChinaColombiaCongo, Dem. Rep.Congo, Rep.Costa RicaCote d'IvoireCroatiaCubaCuracaoCyprusCzech RepublicDenmarkDominican RepublicEarly-demographic dividendEast Asia & PacificEast Asia & Pacific (excluding high income)East Asia & Pacific (IDA & IBRD countries)EcuadorEgypt, Arab Rep.El SalvadorEritreaEstoniaEthiopiaEuro areaEurope & Central AsiaEurope & Central Asia (excluding high income)Europe & Central Asia (IDA & IBRD countries)European UnionFinlandFragile and conflict affected situationsFranceGabonGeorgiaGermanyGhanaGibraltarGreeceGuatemalaHaitiHeavily indebted poor countries (HIPC)High incomeHondurasHong Kong SAR, ChinaHungaryIBRD onlyIcelandIDA & IBRD totalIDA blendIDA onlyIDA totalIndiaIndonesiaIran, Islamic Rep.IraqIrelandIsraelItalyJamaicaJapanJordanKazakhstanKenyaKorea, Dem. People’s Rep.Korea, Rep.KosovoKuwaitKyrgyz RepublicLate-demographic dividendLatin America & Caribbean Latin America & Caribbean (excluding high income)Latin America & the Caribbean (IDA & IBRD countries)LatviaLeast developed countries: UN classificationLebanonLibyaLithuaniaLow & middle incomeLow incomeLower middle incomeLuxembourgMacedonia, FYRMalaysiaMaltaMauritiusMexicoMiddle East & North AfricaMiddle East & North Africa (excluding high income)Middle East & North Africa (IDA & IBRD countries)Middle incomeMoldovaMongoliaMontenegroMoroccoMozambiqueMyanmarNamibiaNepalNetherlandsNew ZealandNicaraguaNigerNigeriaNorth AmericaNorwayOECD membersOmanOther small statesPakistanPanamaParaguayPeruPhilippinesPolandPortugalPost-demographic dividendPre-demographic dividendQatarRomaniaRussian FederationSaudi ArabiaSenegalSerbiaSingaporeSlovak RepublicSloveniaSmall statesSouth AfricaSouth AsiaSouth Asia (IDA & IBRD)South SudanSpainSri LankaSub-Saharan Africa Sub-Saharan Africa (excluding high income)Sub-Saharan Africa (IDA & IBRD countries)SudanSwedenSwitzerlandSyrian Arab RepublicTajikistanTanzaniaThailandTogoTrinidad and TobagoTunisiaTurkeyTurkmenistanUkraineUnited Arab EmiratesUnited KingdomUnited StatesUpper middle incomeUruguayUzbekistanVenezuela, RBVietnamWorldYemen, Rep.ZambiaZimbabwe Timeline:
This timeline shows a graph from 1972 to 2014 of Hong Kong SAR, China. No data until 1971. Number of actual observations by date: 43.
Source name:
World Development Indicators
Source organization:
IEA Statistics © OECD/IEA 2014 (http://www.iea.org/stats/index.asp), subject to https://www.iea.org/t&c/termsandconditions/
Categories, topics:
Environment
Last updated:
apr 23, 2017
Indicators value changes by year
Maximum:
32.364
jan 1, 1975
At the date of observation
Value
Absolute change
Change from previous value
jan 1, 1972
27.519
+27.519
0.0%
jan 1, 1973
25.523
-1.996
-7.25%
jan 1, 1974
22.015
-3.508
-13.75%
jan 1, 1975
32.364
+10.349
47.01%
jan 1, 1976
27.456
-4.907
-15.16%
jan 1, 1977
30.317
+2.861
10.42%
jan 1, 1978
31.546
+1.229
4.05%
jan 1, 1979
29.987
-1.559
-4.94%
jan 1, 1980
18.15
-11.837
-39.47%
jan 1, 1981
14.726
-3.424
-18.86%
jan 1, 1982
14.956
+0.23
1.56%
jan 1, 1983
16.754
+1.799
12.03%
jan 1, 1984
14.826
-1.928
-11.51%
jan 1, 1985
15.493
+0.667
4.5%
jan 1, 1986
12.691
-2.802
-18.09%
jan 1, 1987
12.47
-0.22
-1.74%
jan 1, 1988
12.248
-0.222
-1.78%
jan 1, 1989
13.185
+0.937
7.65%
jan 1, 1990
12.326
-0.859
-6.51%
jan 1, 1991
8.979
-3.347
-27.16%
jan 1, 1992
5.964
-3.015
-33.58%
jan 1, 1993
9.107
+3.143
52.7%
jan 1, 1994
6.877
-2.23
-24.49%
jan 1, 1995
9.083
+2.207
32.09%
jan 1, 1996
8.023
-1.06
-11.67%
jan 1, 1997
7.522
-0.501
-6.24%
jan 1, 1998
7.937
+0.415
5.51%
jan 1, 1999
10.644
+2.708
34.12%
jan 1, 2000
13.158
+2.513
23.61%
jan 1, 2001
10.585
-2.573
-19.55%
jan 1, 2002
13.393
+2.808
26.53%
jan 1, 2003
11.316
-2.077
-15.51%
jan 1, 2004
9.04
-2.276
-20.11%
jan 1, 2005
12.075
+3.035
33.58%
jan 1, 2006
9.485
-2.591
-21.45%
jan 1, 2007
13.185
+3.701
39.02%
jan 1, 2008
14.172
+0.987
7.48%
jan 1, 2009
15.263
+1.09
7.69%
jan 1, 2010
15.917
+0.654
4.29%
jan 1, 2011
13.36
-2.557
-16.06%
jan 1, 2012
15.513
+2.152
16.11%
jan 1, 2013
15.946
+0.433
2.79%
jan 1, 2014
15.831
-0.115
-0.72%
Ranking of countries by current statistics by years


Comments: