29
/
en
AIzaSyAYiBZKx7MnpbEhh9jyipgxe19OcubqV5w
April 1, 2024
44109
Least developed countries: UN classification
LDC
false
2
1
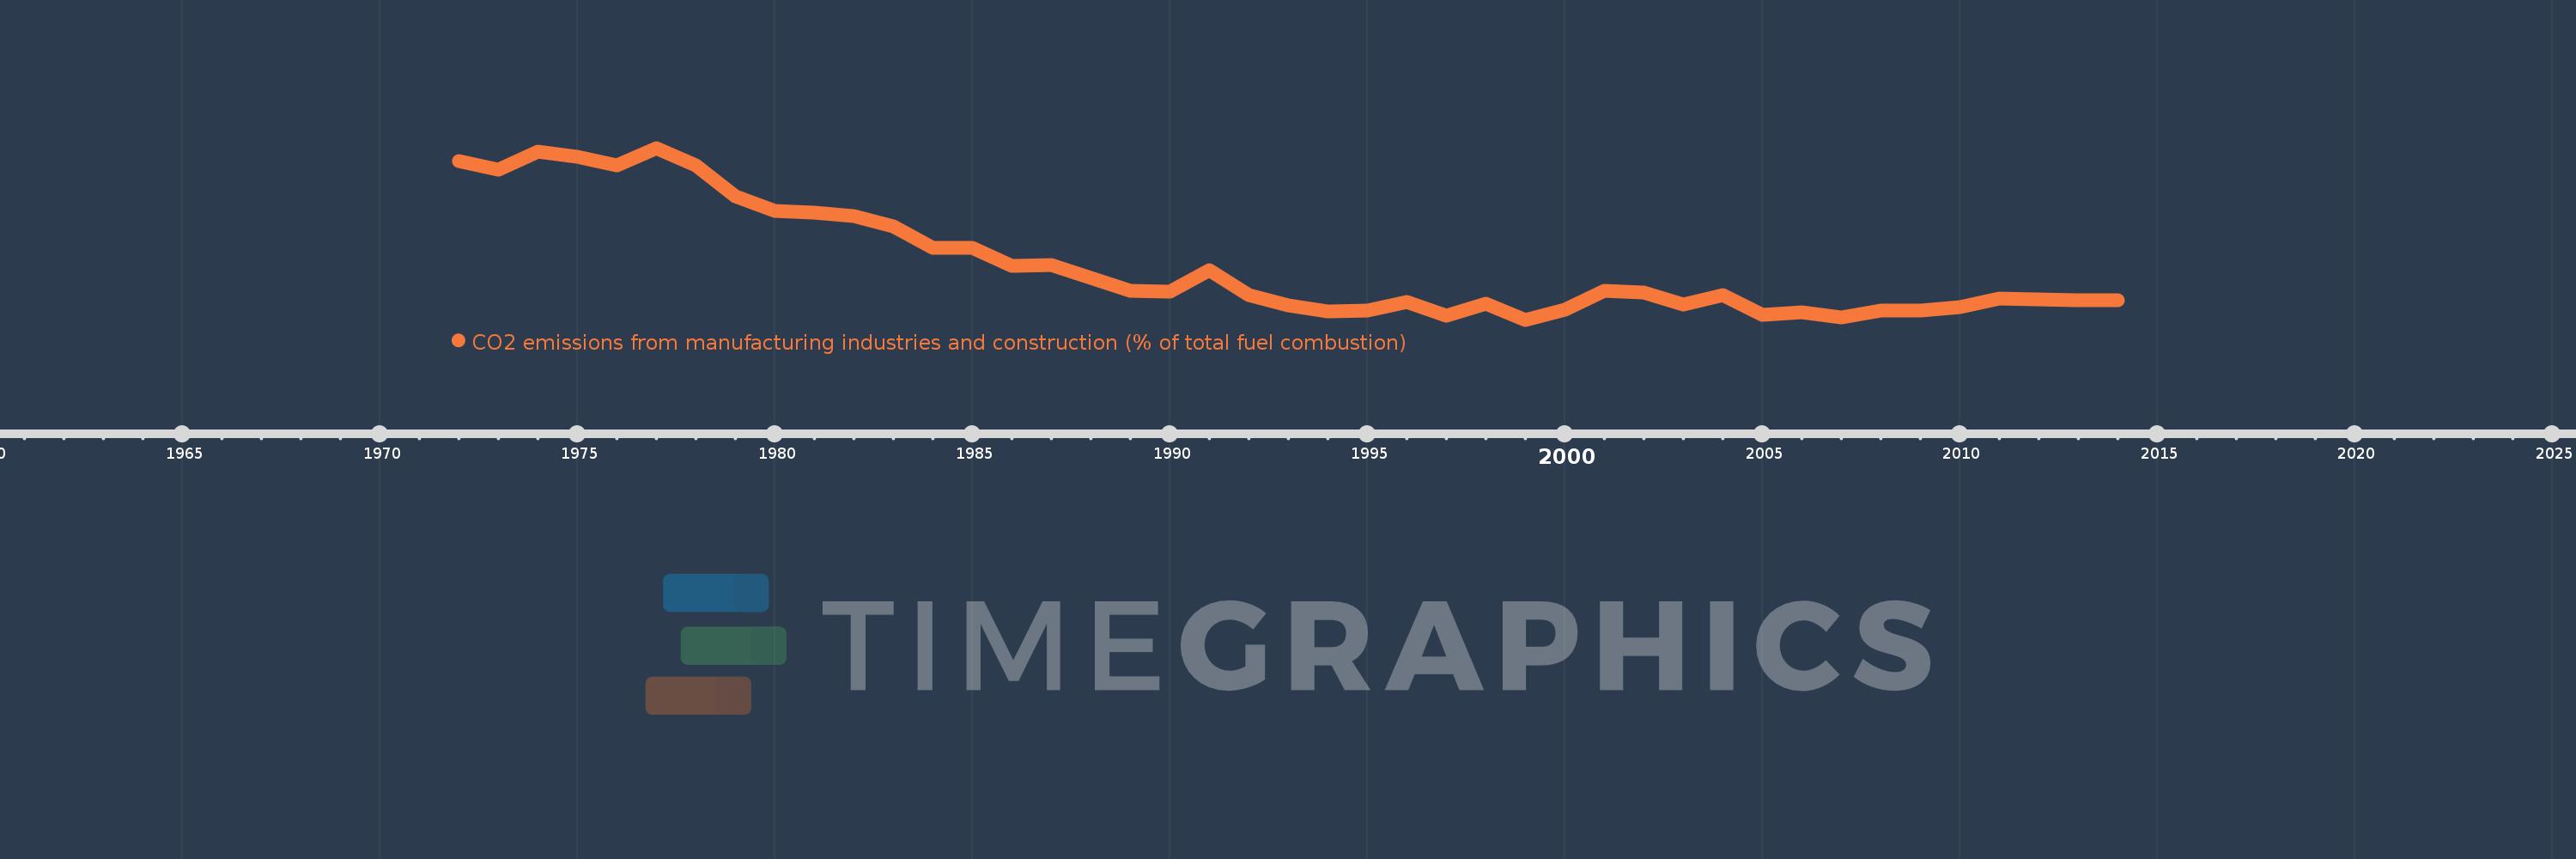
CO2 emissions from manufacturing industries and construction (% of total fuel combustion)
2014,2013,2012,2011,2010,2009,2008,2007,2006,2005,2004,2003,2002,2001,2000,1999,1998,1997,1996,1995,1994,1993,1992,1991,1990,1989,1988,1987,1986,1985,1984,1983,1982,1981,1980,1979,1978,1977,1976,1975,1974,1973,1972
This statistics in other country:
AlbaniaAlgeriaAngolaArab WorldArgentinaArmeniaAustraliaAustriaAzerbaijanBahrainBangladeshBelarusBelgiumBeninBoliviaBosnia and HerzegovinaBotswanaBrazilBrunei DarussalamBulgariaCambodiaCameroonCanadaCaribbean small statesCentral Europe and the BalticsChileChinaColombiaCongo, Dem. Rep.Congo, Rep.Costa RicaCote d'IvoireCroatiaCubaCuracaoCyprusCzech RepublicDenmarkDominican RepublicEarly-demographic dividendEast Asia & PacificEast Asia & Pacific (excluding high income)East Asia & Pacific (IDA & IBRD countries)EcuadorEgypt, Arab Rep.El SalvadorEritreaEstoniaEthiopiaEuro areaEurope & Central AsiaEurope & Central Asia (excluding high income)Europe & Central Asia (IDA & IBRD countries)European UnionFinlandFragile and conflict affected situationsFranceGabonGeorgiaGermanyGhanaGibraltarGreeceGuatemalaHaitiHeavily indebted poor countries (HIPC)High incomeHondurasHong Kong SAR, ChinaHungaryIBRD onlyIcelandIDA & IBRD totalIDA blendIDA onlyIDA totalIndiaIndonesiaIran, Islamic Rep.IraqIrelandIsraelItalyJamaicaJapanJordanKazakhstanKenyaKorea, Dem. People’s Rep.Korea, Rep.KosovoKuwaitKyrgyz RepublicLate-demographic dividendLatin America & Caribbean Latin America & Caribbean (excluding high income)Latin America & the Caribbean (IDA & IBRD countries)LatviaLeast developed countries: UN classificationLebanonLibyaLithuaniaLow & middle incomeLow incomeLower middle incomeLuxembourgMacedonia, FYRMalaysiaMaltaMauritiusMexicoMiddle East & North AfricaMiddle East & North Africa (excluding high income)Middle East & North Africa (IDA & IBRD countries)Middle incomeMoldovaMongoliaMontenegroMoroccoMozambiqueMyanmarNamibiaNepalNetherlandsNew ZealandNicaraguaNigerNigeriaNorth AmericaNorwayOECD membersOmanOther small statesPakistanPanamaParaguayPeruPhilippinesPolandPortugalPost-demographic dividendPre-demographic dividendQatarRomaniaRussian FederationSaudi ArabiaSenegalSerbiaSingaporeSlovak RepublicSloveniaSmall statesSouth AfricaSouth AsiaSouth Asia (IDA & IBRD)South SudanSpainSri LankaSub-Saharan Africa Sub-Saharan Africa (excluding high income)Sub-Saharan Africa (IDA & IBRD countries)SudanSwedenSwitzerlandSyrian Arab RepublicTajikistanTanzaniaThailandTogoTrinidad and TobagoTunisiaTurkeyTurkmenistanUkraineUnited Arab EmiratesUnited KingdomUnited StatesUpper middle incomeUruguayUzbekistanVenezuela, RBVietnamWorldYemen, Rep.ZambiaZimbabwe Timeline:
This timeline shows a graph from 1972 to 2014 of Least developed countries: UN classification. No data until 1971. Number of actual observations by date: 43.
Source name:
World Development Indicators
Source organization:
IEA Statistics © OECD/IEA 2014 (http://www.iea.org/stats/index.asp), subject to https://www.iea.org/t&c/termsandconditions/
Categories, topics:
Environment
Last updated:
apr 23, 2017
Indicators value changes by year
Minimum:
15.126
jan 1, 1999
Maximum:
34.412
jan 1, 1977
At the date of observation
Value
Absolute change
Change from previous value
jan 1, 1972
32.945
+32.945
0.0%
jan 1, 1973
32.004
-0.94
-2.85%
jan 1, 1974
34.005
+2.0
6.25%
jan 1, 1975
33.407
-0.597
-1.76%
jan 1, 1976
32.42
-0.987
-2.96%
jan 1, 1977
34.412
+1.992
6.14%
jan 1, 1978
32.426
-1.987
-5.77%
jan 1, 1979
29.002
-3.424
-10.56%
jan 1, 1980
27.383
-1.618
-5.58%
jan 1, 1981
27.14
-0.243
-0.89%
jan 1, 1982
26.795
-0.345
-1.27%
jan 1, 1983
25.565
-1.229
-4.59%
jan 1, 1984
23.186
-2.38
-9.31%
jan 1, 1985
23.215
+0.03
0.13%
jan 1, 1986
21.171
-2.044
-8.81%
jan 1, 1987
21.309
+0.138
0.65%
jan 1, 1988
19.775
-1.535
-7.2%
jan 1, 1989
18.384
-1.391
-7.03%
jan 1, 1990
18.237
-0.146
-0.8%
jan 1, 1991
20.716
+2.478
13.59%
jan 1, 1992
17.914
-2.802
-13.53%
jan 1, 1993
16.72
-1.193
-6.66%
jan 1, 1994
16.026
-0.694
-4.15%
jan 1, 1995
16.11
+0.083
0.52%
jan 1, 1996
17.148
+1.039
6.45%
jan 1, 1997
15.593
-1.556
-9.07%
jan 1, 1998
16.95
+1.357
8.71%
jan 1, 1999
15.126
-1.824
-10.76%
jan 1, 2000
16.284
+1.158
7.65%
jan 1, 2001
18.338
+2.054
12.61%
jan 1, 2002
18.22
-0.118
-0.64%
jan 1, 2003
16.85
-1.37
-7.52%
jan 1, 2004
17.932
+1.082
6.42%
jan 1, 2005
15.636
-2.296
-12.8%
jan 1, 2006
15.95
+0.314
2.01%
jan 1, 2007
15.421
-0.529
-3.32%
jan 1, 2008
16.151
+0.73
4.73%
jan 1, 2009
16.13
-0.02
-0.12%
jan 1, 2010
16.532
+0.401
2.49%
jan 1, 2011
17.516
+0.985
5.96%
jan 1, 2012
17.4
-0.116
-0.66%
jan 1, 2013
17.312
-0.088
-0.51%
jan 1, 2014
17.328
+0.016
0.09%
Ranking of countries by current statistics by years


Comments: